ValidMind for development 2 — Start the development process

Learn how to use ValidMind for your end-to-end documentation process with our series of four introductory notebooks. In this second notebook, you'll run tests and investigate results, then add the results or evidence to your documentation.

You'll become familiar with the individual tests available in ValidMind, as well as how to run them and change parameters as necessary. Using ValidMind's repository of individual tests as building blocks helps you ensure that a record (model) is being built appropriately.

For a full list of out-of-the-box tests and descriptions, use the interactive ValidMind test sandbox.

Learn by doing

Our course tailor-made for developers new to ValidMind combines this series of notebooks with more a more in-depth introduction to the ValidMind Platform — Developer Fundamentals

Prerequisites

In order to log test results or evidence to your documentation with this notebook, you'll need to first have:

Need help with the above steps?

Refer to the first notebook in this series: 1 — Set up the ValidMind Library

Setting up

Initialize the ValidMind Library

First, let's connect up the ValidMind Library to our model we previously registered in the ValidMind Platform:

  1. On the left sidebar that appears for your model, select Getting Started and select Development from the Document drop-down menu.

  2. Click Copy snippet to clipboard.

  3. Next, load your model identifier credentials from an .env file or replace the placeholder with your own code snippet:

# Make sure the ValidMind Library is installed

%pip install -q validmind

# Load your model identifier credentials from an `.env` file

%load_ext dotenv
%dotenv .env

# Or replace with your code snippet

import validmind as vm

vm.init(
    # api_host="...",
    # api_key="...",
    # api_secret="...",
    # model="...",
    document="documentation",
)
Note: you may need to restart the kernel to use updated packages.
2026-09-24 21:45:53,943 - INFO(validmind.api_client): 🎉 Connected to ValidMind!
📊 Model: [ValidMind Academy] Model development (ID: cmalgf3qi02ce199qm3rdkl46)
📁 Document Type: model_documentation

Import sample dataset

Then, let's import the public Bank Customer Churn Prediction dataset from Kaggle.

In our below example, note that:

  • The target column, Exited has a value of 1 when a customer has churned and 0 otherwise.
  • The ValidMind Library provides a wrapper to automatically load the dataset as a Pandas DataFrame object. A Pandas Dataframe is a two-dimensional tabular data structure that makes use of rows and columns.
from validmind.datasets.classification import customer_churn as demo_dataset

print(
    f"Loaded demo dataset with: \n\n\t• Target column: '{demo_dataset.target_column}' \n\t• Class labels: {demo_dataset.class_labels}"
)

raw_df = demo_dataset.load_data()
raw_df.head()
Loaded demo dataset with: 

    • Target column: 'Exited' 
    • Class labels: {'0': 'Did not exit', '1': 'Exited'}
CreditScore Geography Gender Age Tenure Balance NumOfProducts HasCrCard IsActiveMember EstimatedSalary Exited
0 619 France Female 42 2 0.00 1 1 1 101348.88 1
1 608 Spain Female 41 1 83807.86 1 0 1 112542.58 0
2 502 France Female 42 8 159660.80 3 1 0 113931.57 1
3 699 France Female 39 1 0.00 2 0 0 93826.63 0
4 850 Spain Female 43 2 125510.82 1 1 1 79084.10 0

Identify qualitative tests

Next, let's say we want to do some data quality assessments by running a few individual tests.

Use the vm.tests.list_tests() function introduced by the first notebook in this series in combination with vm.tests.list_tags() and vm.tests.list_tasks() to find which prebuilt tests are relevant for data quality assessment:

  • tasks represent the kind of modeling task associated with a test. Here we'll focus on classification tasks.
  • tags are free-form descriptions providing more details about the test, for example, what category the test falls into. Here we'll focus on the data_quality tag.
# Get the list of available task types
sorted(vm.tests.list_tasks())
['classification',
 'clustering',
 'data_validation',
 'feature_extraction',
 'monitoring',
 'nlp',
 'regression',
 'residual_analysis',
 'text_classification',
 'text_generation',
 'text_qa',
 'text_summarization',
 'time_series_forecasting',
 'visualization']
# Get the list of available tags
sorted(vm.tests.list_tags())
['AUC',
 'analysis',
 'anomaly',
 'anomaly_detection',
 'bias_and_fairness',
 'binary_classification',
 'calibration',
 'categorical_data',
 'classification',
 'classification_metrics',
 'clustering',
 'correlation',
 'credit_risk',
 'data_analysis',
 'data_distribution',
 'data_quality',
 'data_validation',
 'descriptive_statistics',
 'dimensionality_reduction',
 'distribution',
 'embeddings',
 'feature_importance',
 'feature_selection',
 'few_shot',
 'forecasting',
 'frequency_analysis',
 'kmeans',
 'linear_regression',
 'llm',
 'logistic_regression',
 'metadata',
 'model_comparison',
 'model_diagnosis',
 'model_explainability',
 'model_interpretation',
 'model_performance',
 'model_predictions',
 'model_selection',
 'model_training',
 'model_validation',
 'multiclass_classification',
 'nlp',
 'normality',
 'numerical_data',
 'outlier',
 'outliers',
 'qualitative',
 'rag_performance',
 'ragas',
 'regression',
 'retrieval_performance',
 'scorecard',
 'seasonality',
 'senstivity_analysis',
 'sklearn',
 'stationarity',
 'statistical_test',
 'statistics',
 'statsmodels',
 'tabular_data',
 'text_data',
 'threshold_optimization',
 'time_series_data',
 'unit_root_test',
 'visualization',
 'zero_shot']

You can pass tags and tasks as parameters to the vm.tests.list_tests() function to filter the tests based on the tags and task types.

For example, to find tests related to tabular data quality for classification models, you can call list_tests() like this:

vm.tests.list_tests(task="classification", tags=["tabular_data", "data_quality"])
ID Name Description Has Figure Has Table Required Inputs Params Tags Tasks
validmind.data_validation.ClassImbalance Class Imbalance Evaluates and quantifies class distribution imbalance in a dataset used by a machine learning model.... True True ['dataset'] {'min_percent_threshold': {'type': 'int', 'default': 10}} ['tabular_data', 'binary_classification', 'multiclass_classification', 'data_quality'] ['classification']
validmind.data_validation.DescriptiveStatistics Descriptive Statistics Performs a detailed descriptive statistical analysis of both numerical and categorical data within a model's... False True ['dataset'] {} ['tabular_data', 'time_series_data', 'data_quality'] ['classification', 'regression']
validmind.data_validation.Duplicates Duplicates Tests dataset for duplicate entries, ensuring model reliability via data quality verification.... False True ['dataset'] {'min_threshold': {'type': '_empty', 'default': 1}} ['tabular_data', 'data_quality', 'text_data'] ['classification', 'regression']
validmind.data_validation.HighCardinality High Cardinality Assesses the number of unique values in categorical columns to detect high cardinality and potential overfitting.... False True ['dataset'] {'num_threshold': {'type': 'int', 'default': 100}, 'percent_threshold': {'type': 'float', 'default': 0.1}, 'threshold_type': {'type': 'str', 'default': 'percent'}} ['tabular_data', 'data_quality', 'categorical_data'] ['classification', 'regression']
validmind.data_validation.HighPearsonCorrelation High Pearson Correlation Identifies highly correlated feature pairs in a dataset suggesting feature redundancy or multicollinearity.... False True ['dataset'] {'max_threshold': {'type': 'float', 'default': 0.3}, 'top_n_correlations': {'type': 'int', 'default': 10}, 'feature_columns': {'type': 'list', 'default': None}} ['tabular_data', 'data_quality', 'correlation'] ['classification', 'regression']
validmind.data_validation.MissingValues Missing Values Evaluates dataset quality by ensuring missing value percentage across all features does not exceed a set threshold.... False True ['dataset'] {'min_percentage_threshold': {'type': 'float', 'default': 1.0}} ['tabular_data', 'data_quality'] ['classification', 'regression']
validmind.data_validation.MissingValuesBarPlot Missing Values Bar Plot Assesses the percentage and distribution of missing values in the dataset via a bar plot, with emphasis on... True False ['dataset'] {'threshold': {'type': 'int', 'default': 80}, 'fig_height': {'type': 'int', 'default': 600}} ['tabular_data', 'data_quality', 'visualization'] ['classification', 'regression']
validmind.data_validation.Skewness Skewness Evaluates the skewness of numerical data in a dataset to check against a defined threshold, aiming to ensure data... False True ['dataset'] {'max_threshold': {'type': '_empty', 'default': 1}} ['data_quality', 'tabular_data'] ['classification', 'regression']
validmind.plots.BoxPlot Box Plot Generates customizable box plots for numerical features in a dataset with optional grouping using Plotly.... True False ['dataset'] {'columns': {'type': 'Optional', 'default': None}, 'group_by': {'type': 'Optional', 'default': None}, 'width': {'type': 'int', 'default': 1800}, 'height': {'type': 'int', 'default': 1200}, 'colors': {'type': 'Optional', 'default': None}, 'show_outliers': {'type': 'bool', 'default': True}, 'title_prefix': {'type': 'str', 'default': 'Box Plot of'}} ['tabular_data', 'visualization', 'data_quality'] ['classification', 'regression', 'clustering']
validmind.plots.HistogramPlot Histogram Plot Generates customizable histogram plots for numerical features in a dataset using Plotly.... True False ['dataset'] {'columns': {'type': 'Optional', 'default': None}, 'bins': {'type': 'Union', 'default': 30}, 'color': {'type': 'str', 'default': 'steelblue'}, 'opacity': {'type': 'float', 'default': 0.7}, 'show_kde': {'type': 'bool', 'default': True}, 'normalize': {'type': 'bool', 'default': False}, 'log_scale': {'type': 'bool', 'default': False}, 'title_prefix': {'type': 'str', 'default': 'Histogram of'}, 'width': {'type': 'int', 'default': 1200}, 'height': {'type': 'int', 'default': 800}, 'n_cols': {'type': 'int', 'default': 2}, 'vertical_spacing': {'type': 'float', 'default': 0.15}, 'horizontal_spacing': {'type': 'float', 'default': 0.1}} ['tabular_data', 'visualization', 'data_quality'] ['classification', 'regression', 'clustering']
validmind.stats.DescriptiveStats Descriptive Stats Provides comprehensive descriptive statistics for numerical features in a dataset.... False True ['dataset'] {'columns': {'type': 'Optional', 'default': None}, 'include_advanced': {'type': 'bool', 'default': True}, 'confidence_level': {'type': 'float', 'default': 0.95}} ['tabular_data', 'statistics', 'data_quality'] ['classification', 'regression', 'clustering']
Want to learn more about navigating ValidMind tests?

Refer to our notebook outlining the utilities available for viewing and understanding available ValidMind tests: Explore tests

Initialize the ValidMind dataset

With the individual tests we want to run identified, the next step is to connect your data with a ValidMind Dataset object. This step is always necessary every time you want to connect a dataset to documentation and produce test results through ValidMind, but you only need to do it once per dataset.

Initialize a ValidMind dataset object using the init_dataset function from the ValidMind (vm) module. For this example, we'll pass in the following arguments:

  • dataset — The raw dataset that you want to provide as input to tests.
  • input_id — A unique identifier that allows tracking what inputs are used when running each individual test.
  • target_column — A required argument if tests require access to true values. This is the name of the target column in the dataset.
# vm_raw_dataset is now a VMDataset object that you can pass to any ValidMind test
vm_raw_dataset = vm.init_dataset(
    dataset=raw_df,
    input_id="raw_dataset",
    target_column="Exited",
)

Running tests on datasets

Now that we know how to initialize a ValidMind dataset object, we're ready to run some tests!

You run individual tests by calling the run_test function provided by the validmind.tests module. For the examples below, we'll pass in the following arguments:

  • test_id — The ID of the test to run, as seen in the ID column when you run list_tests.
  • params — A dictionary of parameters for the test. These will override any default_params set in the test definition.

Run tabular data tests

The inputs expected by a test can also be found in the test definition — let's take validmind.data_validation.DescriptiveStatistics as an example.

Note that the output of the describe_test() function below shows that this test expects a dataset as input:

vm.tests.describe_test("validmind.data_validation.DescriptiveStatistics")
▶ Test: Descriptive Statistics ('validmind.data_validation.DescriptiveStatistics')

Now, let's run a few tests to assess the quality of the dataset:

result = vm.tests.run_test(
    test_id="validmind.data_validation.DescriptiveStatistics",
    inputs={"dataset": vm_raw_dataset},
)

Descriptive Statistics

The Descriptive Statistics test evaluates the distributional characteristics of numerical and categorical variables in the dataset. The results are presented in separate summary tables for eight numerical variables and two categorical variables, reporting counts, central tendency, dispersion, percentile values, and category concentration. All listed variables have a count of 8,000 observations, and the numerical summaries include percentile information through the 95th percentile alongside observed minima and maxima. The categorical summaries report the number of unique values and the most frequent category with its frequency and share.

Key insights:

  • Complete coverage across variables: All numerical and categorical variables show a count of 8,000, indicating that the reported summaries were calculated on the full set of observations for each listed field.

  • Balance shows strong lower-tail concentration: Balance has a minimum of 0, a 25th percentile of 0, and a median of 97,264, indicating that at least one quarter of observations are at zero while the distribution extends to higher values up to 250,898. The mean of 76,434.10 is below the median, reflecting this concentration at the lower end.

  • Credit score and age are broadly distributed: CreditScore spans from 350 to 850 with a mean of 650.16 and median of 652, while Age ranges from 18 to 92 with a mean of 38.95 and median of 37. Both variables show wide observed ranges with central values close to one another.

  • Product holdings are concentrated at low values: NumOfProducts has a mean of 1.53, median of 1, 75th percentile of 2, and maximum of 4. This indicates that the distribution is concentrated in the lower product-count categories.

  • Binary indicators differ in prevalence: HasCrCard has a mean of 0.7026, with the median and upper quartiles equal to 1, showing a larger share of positive values, whereas IsActiveMember has a mean of 0.5199, indicating a more even split between 0 and 1 outcomes.

  • Categorical concentration is moderate: Geography contains 3 unique values, with France as the most frequent category at 4,010 observations (50.12%). Gender contains 2 unique values, with Male as the most frequent category at 4,396 observations (54.95%).

The descriptive statistics show complete observation counts across all reported variables and a mix of broad continuous ranges, low-cardinality discrete fields, and moderately concentrated categorical variables. The most distinct distributional feature is Balance, where zero values occupy at least the lower quartile while the remaining distribution extends to substantially higher amounts. Other variables such as CreditScore, Age, and EstimatedSalary exhibit wide ranges with means and medians that are relatively close, while the categorical fields show a modest concentration in the most frequent categories rather than extreme dominance.

Tables

Numerical Variables

Name Count Mean Std Min 25% 50% 75% 90% 95% Max
CreditScore 8000.0 650.1596 96.8462 350.0 583.0 652.0 717.0 778.0 813.0 850.0
Age 8000.0 38.9489 10.4590 18.0 32.0 37.0 44.0 53.0 60.0 92.0
Tenure 8000.0 5.0339 2.8853 0.0 3.0 5.0 8.0 9.0 9.0 10.0
Balance 8000.0 76434.0965 62612.2513 0.0 0.0 97264.0 128045.0 149545.0 162488.0 250898.0
NumOfProducts 8000.0 1.5325 0.5805 1.0 1.0 1.0 2.0 2.0 2.0 4.0
HasCrCard 8000.0 0.7026 0.4571 0.0 0.0 1.0 1.0 1.0 1.0 1.0
IsActiveMember 8000.0 0.5199 0.4996 0.0 0.0 1.0 1.0 1.0 1.0 1.0
EstimatedSalary 8000.0 99790.1880 57520.5089 12.0 50857.0 99505.0 149216.0 179486.0 189997.0 199992.0

Categorical Variables

Name Count Number of Unique Values Top Value Top Value Frequency Top Value Frequency %
Geography 8000.0 3.0 France 4010.0 50.12
Gender 8000.0 2.0 Male 4396.0 54.95
result2 = vm.tests.run_test(
    test_id="validmind.data_validation.ClassImbalance",
    inputs={"dataset": vm_raw_dataset},
    params={"min_percent_threshold": 30},
)

❌ Class Imbalance

The Class Imbalance test evaluates the distribution of target classes in the dataset by measuring each class’s share of total records against a specified minimum percentage threshold. In this result, the target variable Exited is summarized across two classes, with reported class proportions and a pass/fail assessment based on the configured 30% threshold. The table and accompanying bar chart show that class Exited = 0 accounts for 79.80% of rows, while class Exited = 1 accounts for 20.20% of rows.

Key insights:

  • Majority class dominates distribution: Exited = 0 represents 79.80% of the dataset, making it the substantially larger class in the observed target distribution.
  • Minority class falls below threshold: Exited = 1 accounts for 20.20% of rows, which is below the configured minimum percentage threshold of 30%, resulting in a fail outcome for that class.
  • Asymmetric pass/fail result: The test passes for Exited = 0 and fails for Exited = 1, indicating that the threshold criterion is not met uniformly across target classes.

The results show a two-class target distribution with a pronounced concentration in Exited = 0 and a materially smaller share in Exited = 1. Under the configured 30% minimum class threshold, only the majority class satisfies the test criterion, while the minority class does not. Collectively, the observed class proportions and pass/fail outcomes document an imbalanced target distribution under this test configuration.

Parameters:

{
  "min_percent_threshold": 30
}
            

Tables

Exited Class Imbalance

Exited Percentage of Rows (%) Pass/Fail
0 79.80% Pass
1 20.20% Fail

Figures

ValidMind Figure validmind.data_validation.ClassImbalance:a320

The output above shows that the validmind.data_validation.ClassImbalance test did not pass according to the value we set for min_percent_threshold.

To address this issue, we'll re-run the test on some processed data. In this case let's apply a very simple rebalancing technique to the dataset:

import pandas as pd

raw_copy_df = raw_df.sample(frac=1)  # Create a copy of the raw dataset

# Create a balanced dataset with the same number of exited and not exited customers
exited_df = raw_copy_df.loc[raw_copy_df["Exited"] == 1]
not_exited_df = raw_copy_df.loc[raw_copy_df["Exited"] == 0].sample(n=exited_df.shape[0])

balanced_raw_df = pd.concat([exited_df, not_exited_df])
balanced_raw_df = balanced_raw_df.sample(frac=1, random_state=42)

With this new balanced dataset, you can re-run the individual test to see if it now passes the class imbalance test requirement.

As this is technically a different dataset, remember to first initialize a new ValidMind Dataset object to pass in as input as required by run_test():

# Register new data and now 'balanced_raw_dataset' is the new dataset object of interest
vm_balanced_raw_dataset = vm.init_dataset(
    dataset=balanced_raw_df,
    input_id="balanced_raw_dataset",
    target_column="Exited",
)
# Pass the initialized `balanced_raw_dataset` as input into the test run
result = vm.tests.run_test(
    test_id="validmind.data_validation.ClassImbalance",
    inputs={"dataset": vm_balanced_raw_dataset},
    params={"min_percent_threshold": 30},
)

✅ Class Imbalance

The Class Imbalance test evaluates the distribution of target classes in the dataset by measuring the share of records in each class against a minimum percentage threshold. For the target variable Exited, the results show two classes, 0 and 1, each representing 50.00% of rows. The applied minimum percentage threshold is 30%, and the result table reports a pass/fail status for each class. The accompanying bar chart visually reflects the equal class proportions.

Key insights:

  • Perfectly even class split: Both Exited = 0 and Exited = 1 account for 50.00% of the dataset, indicating no difference in observed class prevalence.
  • All classes exceed threshold: Each class is above the 30% minimum percentage threshold used in this test, and both classes are marked as Pass.
  • No underrepresented target class: The test output shows no class with a lower observed frequency than the configured threshold.

The observed target distribution is balanced across the two Exited classes, with identical 50.00% representation for each outcome. Under the configured 30% threshold, both classes pass the imbalance check. Collectively, the table and chart show a symmetric binary class distribution with no flagged minority class in this test result.

Parameters:

{
  "min_percent_threshold": 30
}
            

Tables

Exited Class Imbalance

Exited Percentage of Rows (%) Pass/Fail
0 50.00% Pass
1 50.00% Pass

Figures

ValidMind Figure validmind.data_validation.ClassImbalance:63d5

Utilize test output

You can utilize the output from a ValidMind test for further use, for example, if you want to remove highly correlated features. Removing highly correlated features helps make the model simpler, more stable, and easier to understand.

Below we demonstrate how to retrieve the list of features with the highest correlation coefficients and use them to reduce the final list of features for modeling.

First, we'll run validmind.data_validation.HighPearsonCorrelation with the balanced_raw_dataset we initialized previously as input as is for comparison with later runs:

corr_result = vm.tests.run_test(
    test_id="validmind.data_validation.HighPearsonCorrelation",
    params={"max_threshold": 0.3},
    inputs={"dataset": vm_balanced_raw_dataset},
)

❌ High Pearson Correlation

The High Pearson Correlation test evaluates pairwise linear relationships between features to identify potentially redundant variables or concentrated dependence within the dataset. The results table reports the top correlations ranked by absolute Pearson coefficient and classifies each pair against the configured threshold of 0.3. Among the ten reported pairs, coefficients range from -0.1923 to 0.3414, and only one pair exceeds the threshold. The highest reported correlation is between Age and Exited, while the remaining listed relationships are below the test limit and are marked as passing.

Key insights:

  • Single threshold breach observed: Age and Exited records a Pearson correlation of 0.3414 and is the only reported pair classified as Fail under the 0.3 threshold.
  • Most reported relationships are weak: The remaining nine reported coefficients fall between -0.1923 and 0.1515, indicating relatively small linear relationships among the other listed feature pairs.
  • Largest non-failing correlation remains below threshold: IsActiveMember and Exited shows the next largest absolute correlation at -0.1923, which remains well below the configured threshold.
  • Reported correlations include both directions: The table contains both positive and negative coefficients, with positive relationships such as Balance and Exited (0.1515) and negative relationships such as Balance and NumOfProducts (-0.1792).

The reported correlation structure is concentrated in a single pair above the configured threshold, with Age and Exited standing out from the remaining top-ranked relationships. All other listed pairs remain below 0.2 in absolute value, indicating limited linear association within the reported top correlations outside that exception. Overall, the test output reflects one flagged relationship and otherwise low-magnitude pairwise correlations among the reported variables.

Parameters:

{
  "max_threshold": 0.3
}
            

Tables

Columns Coefficient Pass/Fail
(Age, Exited) 0.3414 Fail
(IsActiveMember, Exited) -0.1923 Pass
(Balance, NumOfProducts) -0.1792 Pass
(Balance, Exited) 0.1515 Pass
(NumOfProducts, IsActiveMember) 0.0663 Pass
(NumOfProducts, Exited) -0.0507 Pass
(CreditScore, Exited) -0.0502 Pass
(Tenure, IsActiveMember) -0.0447 Pass
(CreditScore, IsActiveMember) 0.0438 Pass
(Age, Tenure) -0.0366 Pass

The output above shows that the test did not pass according to the value we set for max_threshold.

corr_result is an object of type TestResult. We can inspect the result object to see what the test has produced:

print(type(corr_result))
print("Result ID: ", corr_result.result_id)
print("Params: ", corr_result.params)
print("Passed: ", corr_result.passed)
print("Tables: ", corr_result.tables)
<class 'validmind.vm_models.result.result.TestResult'>
Result ID:  validmind.data_validation.HighPearsonCorrelation
Params:  {'max_threshold': 0.3}
Passed:  False
Tables:  [ResultTable]

Let's remove the highly correlated features and create a new VM dataset object.

We'll begin by checking out the table in the result and extracting a list of features that failed the test:

# Extract table from `corr_result.tables`
features_df = corr_result.tables[0].data
features_df
Columns Coefficient Pass/Fail
0 (Age, Exited) 0.3414 Fail
1 (IsActiveMember, Exited) -0.1923 Pass
2 (Balance, NumOfProducts) -0.1792 Pass
3 (Balance, Exited) 0.1515 Pass
4 (NumOfProducts, IsActiveMember) 0.0663 Pass
5 (NumOfProducts, Exited) -0.0507 Pass
6 (CreditScore, Exited) -0.0502 Pass
7 (Tenure, IsActiveMember) -0.0447 Pass
8 (CreditScore, IsActiveMember) 0.0438 Pass
9 (Age, Tenure) -0.0366 Pass
# Extract list of features that failed the test
high_correlation_features = features_df[features_df["Pass/Fail"] == "Fail"]["Columns"].tolist()
high_correlation_features
['(Age, Exited)']

Next, extract the feature names from the list of strings (example: (Age, Exited) > Age):

high_correlation_features = [feature.split(",")[0].strip("()") for feature in high_correlation_features]
high_correlation_features
['Age']

Now, it's time to re-initialize the dataset with the highly correlated features removed.

Note the use of a different input_id. This allows tracking the inputs used when running each individual test.

# Remove the highly correlated features from the dataset
balanced_raw_no_age_df = balanced_raw_df.drop(columns=high_correlation_features)

# Re-initialize the dataset object
vm_raw_dataset_preprocessed = vm.init_dataset(
    dataset=balanced_raw_no_age_df,
    input_id="raw_dataset_preprocessed",
    target_column="Exited",
)

Re-running the test with the reduced feature set should pass the test:

corr_result = vm.tests.run_test(
    test_id="validmind.data_validation.HighPearsonCorrelation",
    params={"max_threshold": 0.3},
    inputs={"dataset": vm_raw_dataset_preprocessed},
)

✅ High Pearson Correlation

The High Pearson Correlation test evaluates pairwise linear relationships between features to identify highly correlated variable pairs that may indicate redundancy or multicollinearity. The results table lists the top 10 strongest correlations observed in the dataset, along with each pair’s Pearson correlation coefficient and pass/fail status under the configured absolute threshold of 0.3. All reported coefficients are relatively small in magnitude, ranging from -0.1923 to 0.1515, and all pairs are marked as Pass.

Key insights:

  • No pair exceeds threshold: All 10 reported feature pairs pass the test against the 0.3 threshold, with no absolute correlation coefficient above 0.1923.
  • Strongest relationship is modest: The largest absolute correlation is between IsActiveMember and Exited at -0.1923, indicating a weak negative linear relationship relative to the configured threshold.
  • Balance shows multiple top associations: Balance appears in four of the 10 listed pairs, with coefficients of -0.1792 against NumOfProducts, 0.1515 against Exited, and -0.0307 against IsActiveMember, indicating that several of the stronger observed relationships involve this feature while remaining below the threshold.
  • Top correlations are concentrated near zero: Aside from the two largest Balance-related relationships and the IsActiveMember-Exited pair, the remaining coefficients fall between -0.0507 and 0.0663, indicating limited linear association among the listed feature pairs.

The observed correlation structure shows no highly correlated feature pairs under the configured 0.3 threshold. The strongest reported relationships are weak in magnitude, and all listed pairs pass the test. Collectively, the results indicate that the top observed pairwise linear associations in this dataset are limited and do not show concentrated high-correlation behavior within the reported feature pairs.

Parameters:

{
  "max_threshold": 0.3
}
            

Tables

Columns Coefficient Pass/Fail
(IsActiveMember, Exited) -0.1923 Pass
(Balance, NumOfProducts) -0.1792 Pass
(Balance, Exited) 0.1515 Pass
(NumOfProducts, IsActiveMember) 0.0663 Pass
(NumOfProducts, Exited) -0.0507 Pass
(CreditScore, Exited) -0.0502 Pass
(Tenure, IsActiveMember) -0.0447 Pass
(CreditScore, IsActiveMember) 0.0438 Pass
(Tenure, EstimatedSalary) 0.0329 Pass
(Balance, IsActiveMember) -0.0307 Pass

You can also plot the correlation matrix to visualize the new correlation between features:

corr_result = vm.tests.run_test(
    test_id="validmind.data_validation.PearsonCorrelationMatrix",
    inputs={"dataset": vm_raw_dataset_preprocessed},
)

Pearson Correlation Matrix

The PearsonCorrelationMatrix test evaluates linear dependency among numerical variables by presenting pairwise Pearson correlation coefficients in a heat map. The matrix includes CreditScore, Tenure, Balance, NumOfProducts, HasCrCard, IsActiveMember, EstimatedSalary, and Exited, with coefficients ranging from -0.19 to 0.15 outside the diagonal of 1.0 self-correlations. Most relationships are clustered close to zero, and the chart highlights the relative magnitude and direction of each pairwise association across the dataset.

Key insights:

  • Correlations are uniformly weak: All off-diagonal correlation coefficients are small in magnitude, with the observed range spanning from -0.19 to 0.15. No pair approaches the 0.7 absolute-correlation threshold described in the test methodology.

  • Strongest inverse relationship is limited: The largest negative correlation is between Exited and IsActiveMember at -0.19. A similarly sized negative relationship appears between Balance and NumOfProducts at -0.18, indicating only modest inverse linear association.

  • Largest positive relationship remains modest: The highest positive off-diagonal correlation is between Balance and Exited at 0.15. Other positive relationships, such as IsActiveMember and NumOfProducts at 0.07, are materially smaller.

  • Exited shows low linear association with other inputs: Correlations between Exited and the other numerical variables range from -0.19 to 0.15. This indicates that no single numerical variable in the matrix has a strong linear relationship with the target.

The correlation structure is sparse and low in magnitude across the numerical variables included in the test. The most pronounced relationships are the negative association between Exited and IsActiveMember and the negative association between Balance and NumOfProducts, but both remain weak in absolute terms. Overall, the result shows limited linear dependence among the variables represented in the matrix.

Figures

ValidMind Figure validmind.data_validation.PearsonCorrelationMatrix:cf59

Documenting test results

Now that we've done some analysis on two different datasets, we can use ValidMind to easily document why certain things were done to our raw data with testing to support it.

Every test result returned by the run_test() function has a .log() method that can be used to send the test results to the ValidMind Platform:

  • When using run_documentation_tests(), documentation sections will be automatically populated with the results of all tests registered in the documentation template.
  • When logging individual test results to the platform, you'll need to manually add those results to the desired section of the documentation.

To demonstrate how to add test results to your documentation, we'll populate the entire Data Preparation section of the documentation using the clean vm_raw_dataset_preprocessed dataset as input, and then document an additional individual result for the highly correlated dataset vm_balanced_raw_dataset.

Run and log multiple tests

run_documentation_tests() allows you to run multiple tests at once and automatically log the results to your documentation. Below, we'll run the tests using the previously initialized vm_raw_dataset_preprocessed as input — this will populate the entire Data Preparation section for every test that is part of the documentation template.

For this example, we'll pass in the following arguments:

  • inputs: Any inputs to be passed to the tests.
  • config: A dictionary <test_id>:<test_config> that allows configuring each test individually. Each test config requires the following:
    • params: Individual test parameters.
    • inputs: Individual test inputs. This overrides any inputs passed from the run_documentation_tests() function.

When including explicit configuration for individual tests, you'll need to specify the inputs even if they mirror what is included in your global configuration.

# Individual test config with inputs specified
test_config = {
    "validmind.data_validation.ClassImbalance": {
        "params": {"min_percent_threshold": 30},
        "inputs": {"dataset": vm_raw_dataset_preprocessed},
    },
    "validmind.data_validation.HighPearsonCorrelation": {
        "params": {"max_threshold": 0.3},
        "inputs": {"dataset": vm_raw_dataset_preprocessed},
    },
}

# Global test config
tests_suite = vm.run_documentation_tests(
    inputs={
        "dataset": vm_raw_dataset_preprocessed,
    },
    config=test_config,
    section=["data_preparation"],
)
Test suite complete!
26/26 (100.0%)

Test Suite Results: Binary Classification V2


Check out the updated documentation on ValidMind.

Template for binary classification models.

▶ Data Preparation

Run and log an individual test

Next, we'll use the previously initialized vm_balanced_raw_dataset (that still has a highly correlated Age column) as input to run an individual test, then log the result to the ValidMind Platform.

When running individual tests, you can use a custom result_id to tag the individual result with a unique identifier:

  • This result_id can be appended to test_id with a : separator.
  • The balanced_raw_dataset result identifier will correspond to the balanced_raw_dataset input, the dataset that still has the Age column.
result = vm.tests.run_test(
    test_id="validmind.data_validation.HighPearsonCorrelation:balanced_raw_dataset",
    params={"max_threshold": 0.3},
    inputs={"dataset": vm_balanced_raw_dataset},
)
result.log()

❌ High Pearson Correlation Balanced Raw Dataset

The High Pearson Correlation test evaluates pairwise linear relationships between features to identify potentially redundant variables and concentrated correlation structure in the dataset. The output lists the top correlation pairs ranked by absolute Pearson coefficient and classifies each pair against the configured threshold of 0.3. In this result, 10 feature pairs are shown, with coefficients ranging from -0.1923 to 0.3414. Only one pair exceeds the threshold and is marked as failing, while the remaining pairs are below the threshold and marked as passing.

Key insights:

  • Single threshold breach observed: The pair (Age, Exited) has the largest absolute correlation at 0.3414 and is the only relationship exceeding the 0.3 threshold, resulting in a fail classification.
  • Remaining relationships are weak: The other nine reported pairs have absolute correlation magnitudes at or below 0.1923, indicating substantially weaker linear relationships than the top-ranked pair.
  • Correlations are mixed in direction: The reported coefficients include both positive and negative values, ranging from -0.1923 for (IsActiveMember, Exited) to 0.1515 for (Balance, Exited) among the passing pairs.
  • Exited appears in multiple top pairs: Several of the highest-ranked relationships involve Exited, including pairings with Age, IsActiveMember, Balance, NumOfProducts, and CreditScore, with only (Age, Exited) breaching the threshold.

Overall, the reported correlation structure is limited, with one feature pair above the configured threshold and all other listed relationships remaining below it. The strongest observed linear association is between Age and Exited, while the rest of the top-ranked correlations are comparatively small in magnitude. Across the displayed results, the dataset shows a predominantly low pairwise linear dependence pattern aside from this single flagged relationship.

Parameters:

{
  "max_threshold": 0.3
}
            

Tables

Columns Coefficient Pass/Fail
(Age, Exited) 0.3414 Fail
(IsActiveMember, Exited) -0.1923 Pass
(Balance, NumOfProducts) -0.1792 Pass
(Balance, Exited) 0.1515 Pass
(NumOfProducts, IsActiveMember) 0.0663 Pass
(NumOfProducts, Exited) -0.0507 Pass
(CreditScore, Exited) -0.0502 Pass
(Tenure, IsActiveMember) -0.0447 Pass
(CreditScore, IsActiveMember) 0.0438 Pass
(Age, Tenure) -0.0366 Pass
2026-09-24 21:47:11,178 - INFO(validmind.vm_models.result.result): Test driven block with result_id validmind.data_validation.HighPearsonCorrelation:balanced_raw_dataset does not exist in model's document
Note the output returned indicating that a test-driven block doesn't currently exist in your documentation for this particular test ID.

That's expected, as when we run individual tests the results logged need to be manually added to your documentation within the ValidMind Platform.

Add individual test results to documentation

With the test results logged, let's head to the model we connected to at the beginning of this notebook and insert our test results into the documentation (Learn more: Work with test results):

  1. From the Inventory in the ValidMind Platform, go to the model you connected to earlier.

  2. In the left sidebar that appears for your model, click Development under Documents.

  3. Locate the Data Preparation section and click on 2.3. Correlations and Interactions to expand that section.

  4. Hover under the Pearson Correlation Matrix content block until a horizontal dashed line with a + button appears, indicating that you can insert a new block.

    Screenshot showing insert block button in model documentation

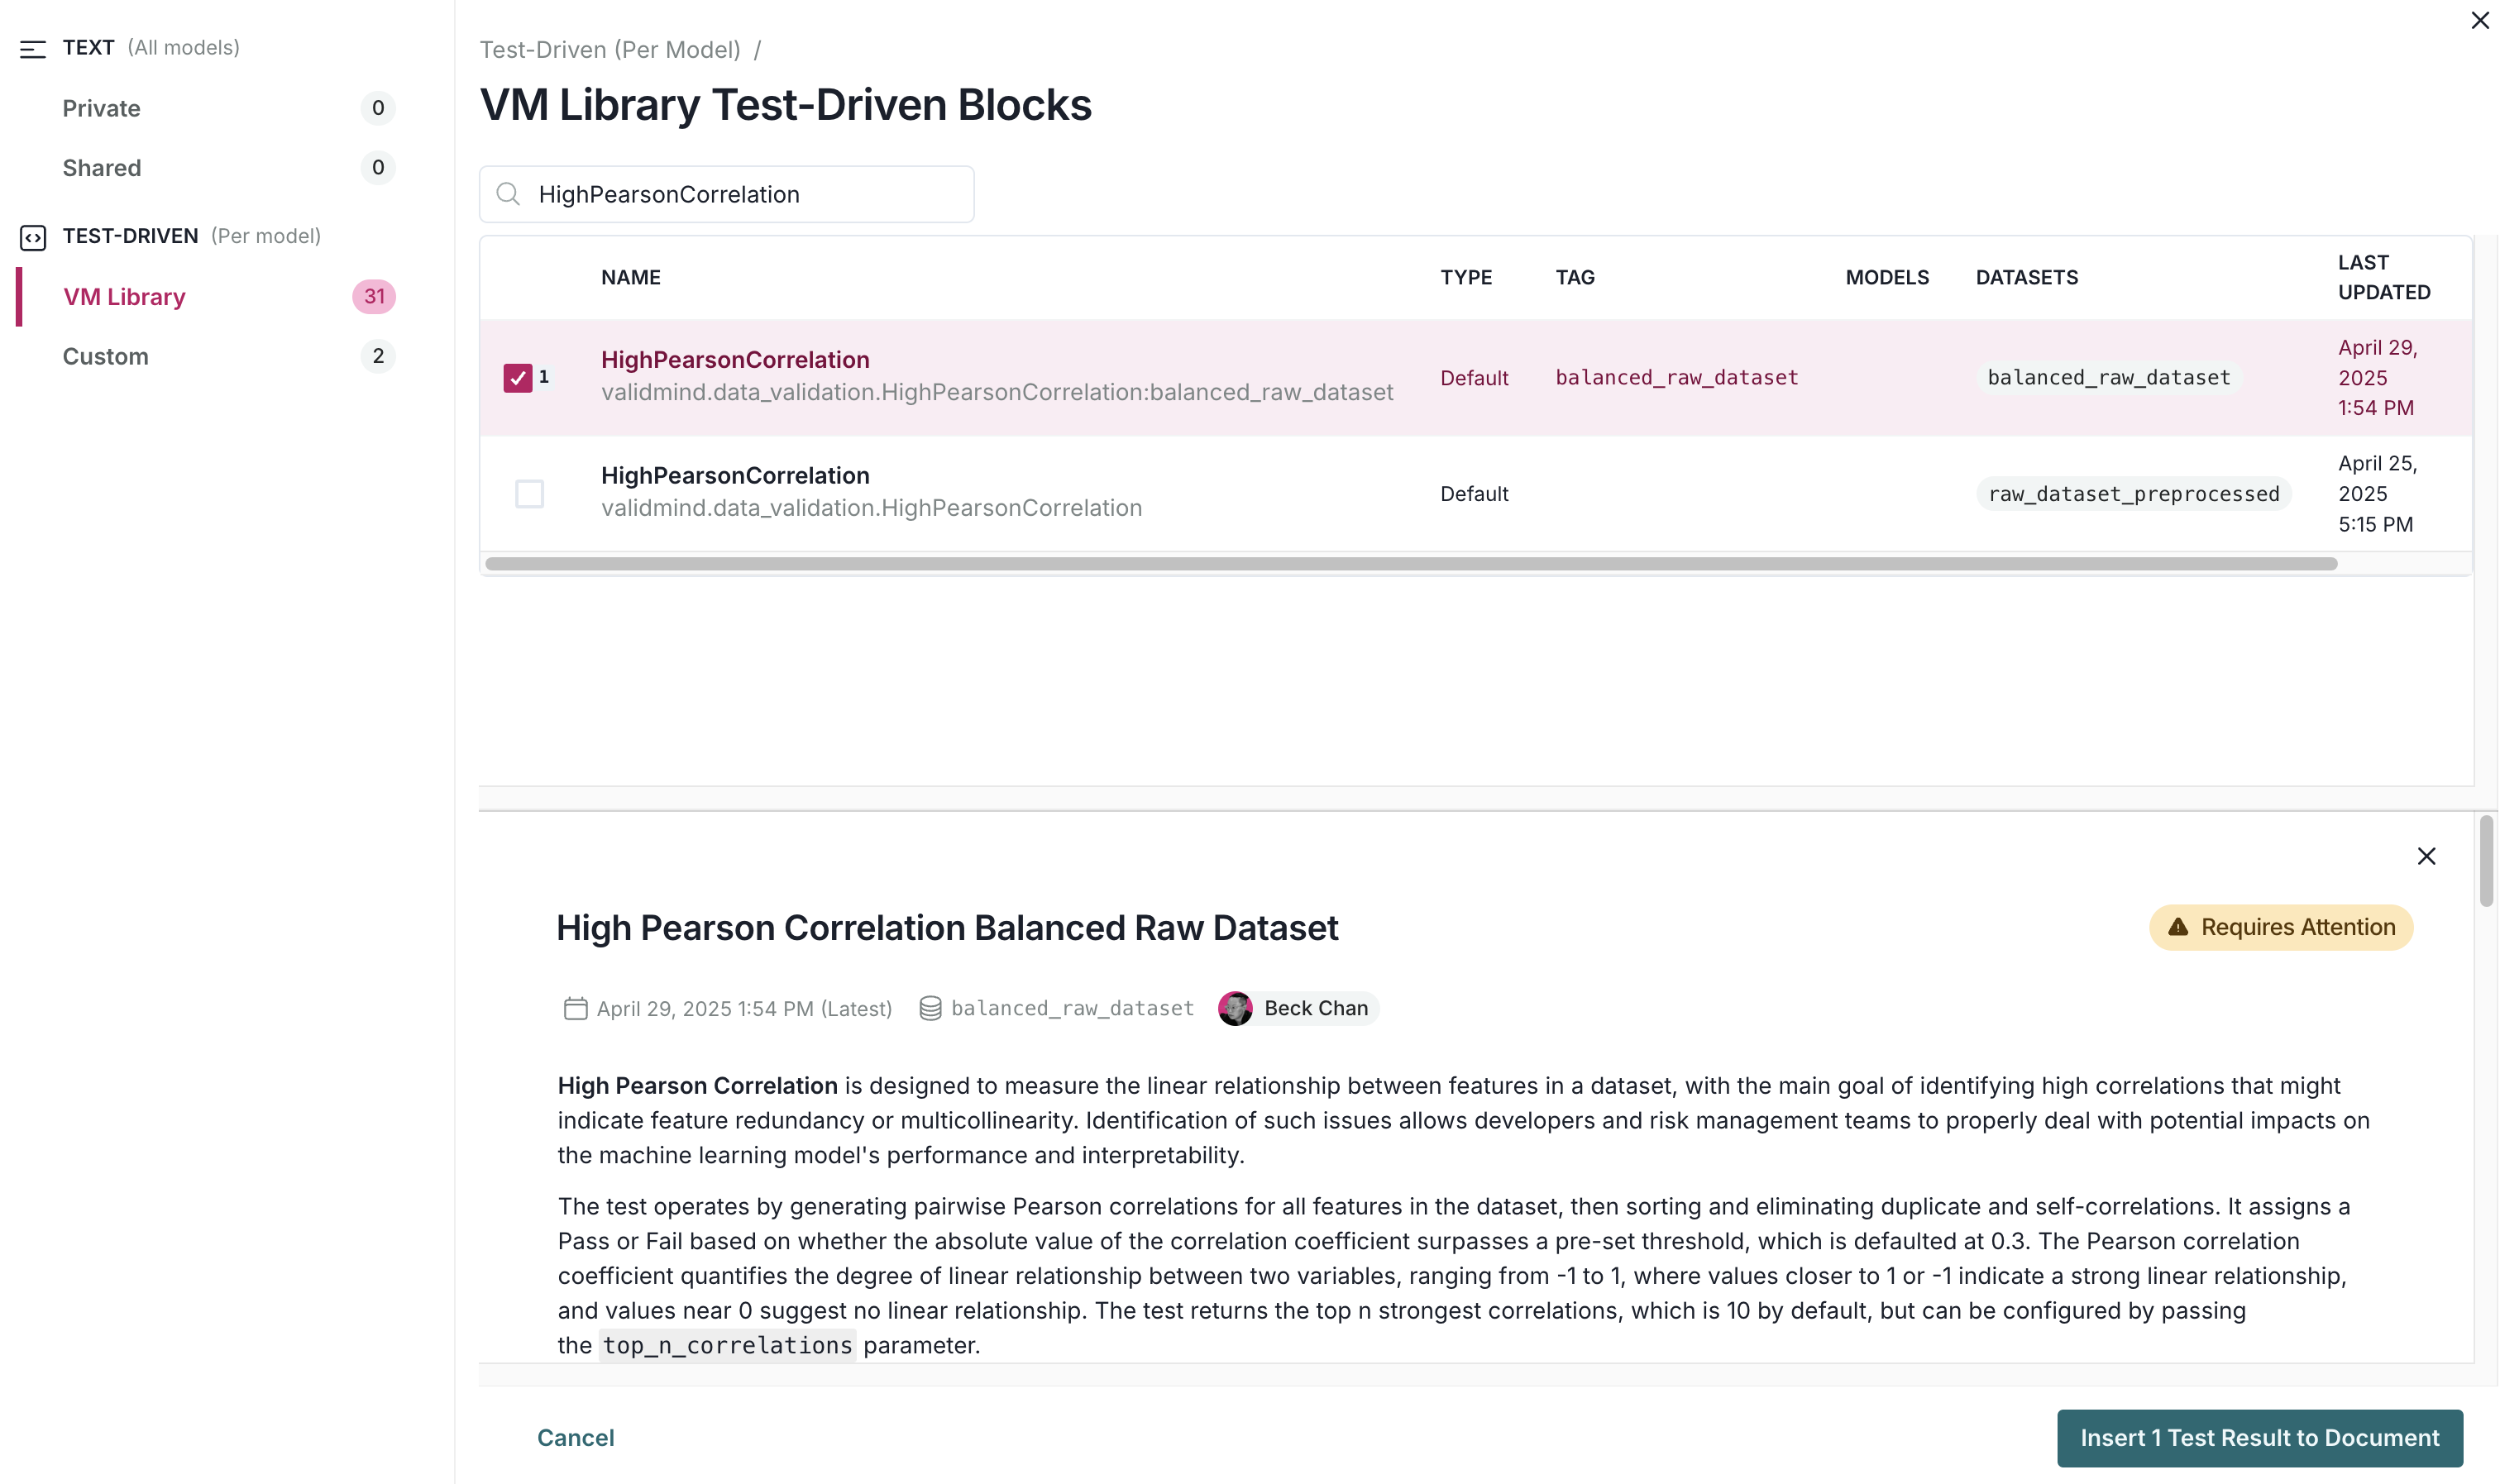
  5. Click + and then select Test-Driven Block under FROM LIBRARY:

    • Click on VM Library under TEST-DRIVEN in the left sidebar.
    • In the search bar, type in HighPearsonCorrelation.
    • Select HighPearsonCorrelation:balanced_raw_dataset as the test.

    A preview of the test gets shown:

    Screenshot showing the HighPearsonCorrelation test selected

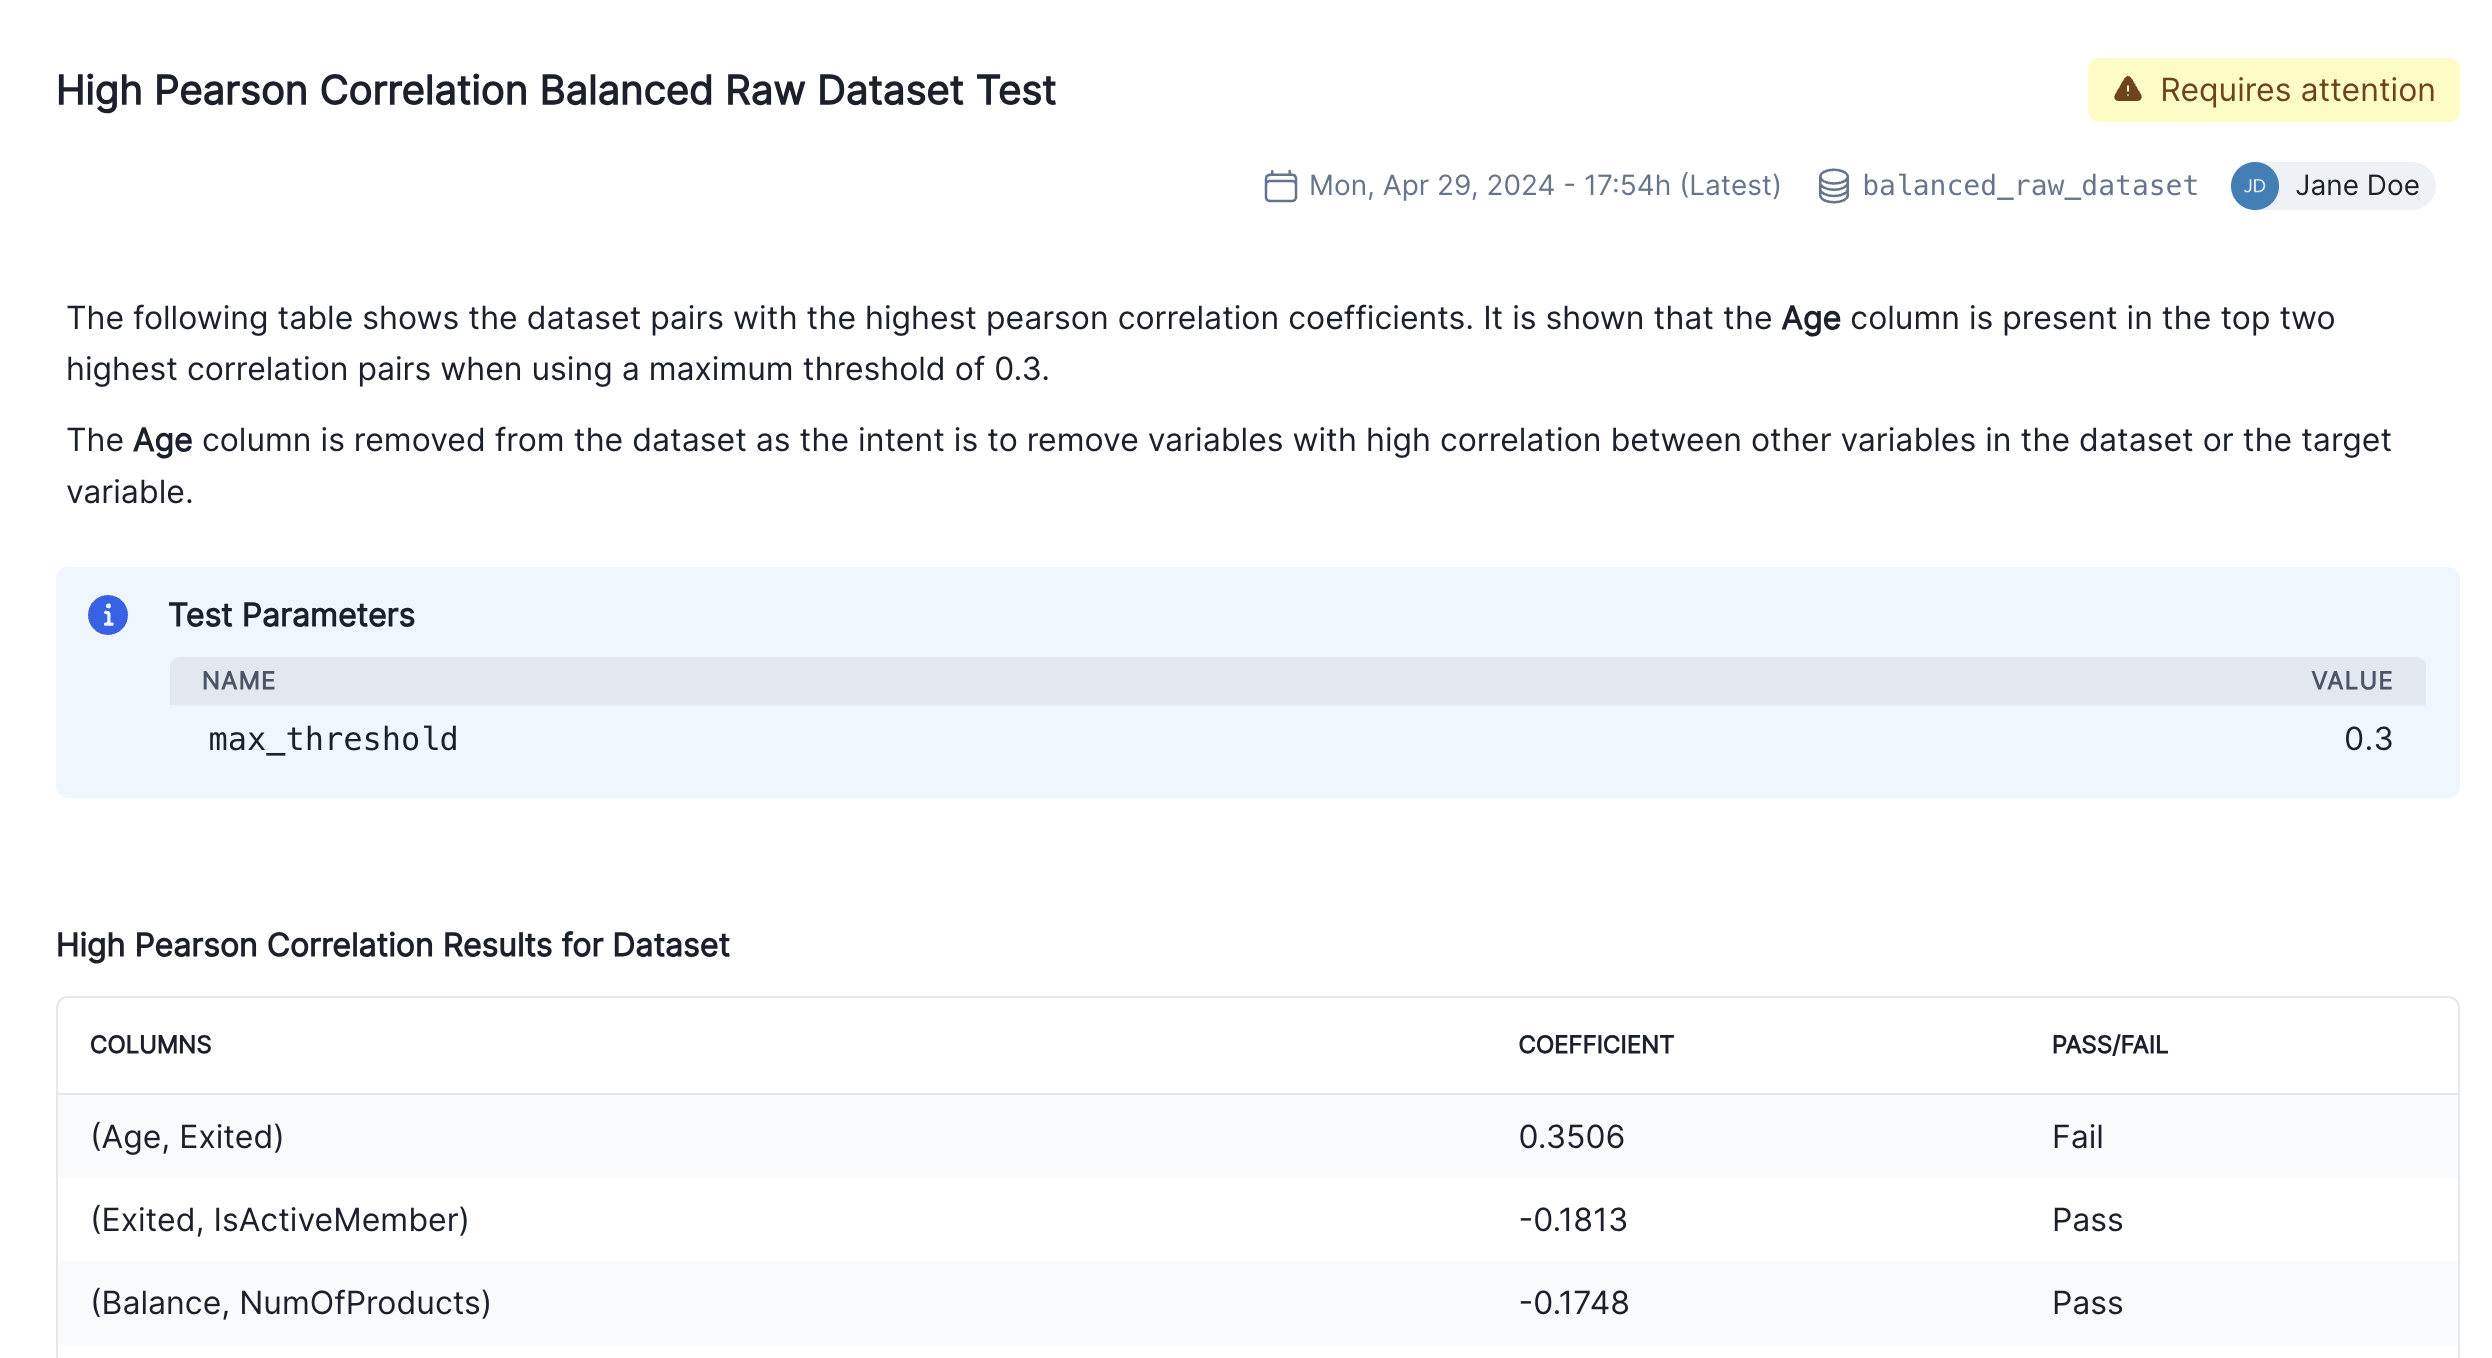
  6. Finally, click Insert 1 Test Result to Document to add the test result to the documentation.

    Confirm that the individual results for the high correlation test has been correctly inserted into section 2.3. Correlations and Interactions of the documentation.

  7. Finalize the documentation by editing the test result's description block to explain the changes you made to the raw data and the reasons behind them as shown in the screenshot below:

    Screenshot showing the inserted High Pearson Correlation block

Running model evaluation tests

So far, we've focused on the data assessment and pre-processing that usually occurs prior to any models being built. Now, let's instead assume we have already built a model and we want to incorporate some model results into our documentation.

Train simple logistic regression model

Using ValidMind tests, we'll train a simple logistic regression model on our dataset and evaluate its performance by using the LogisticRegression class from the sklearn.linear_model.

To start, let's grab the first few rows from the balanced_raw_no_age_df dataset with the highly correlated features removed we initialized earlier:

balanced_raw_no_age_df.head()
CreditScore Geography Gender Tenure Balance NumOfProducts HasCrCard IsActiveMember EstimatedSalary Exited
6013 578 France Male 5 113226.47 1 1 0 56770.76 0
2703 623 Germany Male 8 96759.42 1 1 1 174777.98 0
3594 669 France Female 8 0.00 2 1 0 84049.16 0
4410 677 Germany Male 3 126729.41 1 1 1 26106.39 1
7241 619 Spain Female 4 175406.13 2 1 1 172792.43 1

Before training the model, we need to encode the categorical features in the dataset:

  • Use the OneHotEncoder class from the sklearn.preprocessing module to encode the categorical features.
  • The categorical features in the dataset are Geography and Gender.
balanced_raw_no_age_df = pd.get_dummies(
    balanced_raw_no_age_df, columns=["Geography", "Gender"], drop_first=True
)
balanced_raw_no_age_df.head()
CreditScore Tenure Balance NumOfProducts HasCrCard IsActiveMember EstimatedSalary Exited Geography_Germany Geography_Spain Gender_Male
6013 578 5 113226.47 1 1 0 56770.76 0 False False True
2703 623 8 96759.42 1 1 1 174777.98 0 True False True
3594 669 8 0.00 2 1 0 84049.16 0 False False False
4410 677 3 126729.41 1 1 1 26106.39 1 True False True
7241 619 4 175406.13 2 1 1 172792.43 1 False True False

We'll split our preprocessed dataset into training and testing, to help assess how well the model generalizes to unseen data:

  • We start by dividing our balanced_raw_no_age_df dataset into training and test subsets using train_test_split, with 80% of the data allocated to training (train_df) and 20% to testing (test_df).
  • From each subset, we separate the features (all columns except "Exited") into X_train and X_test, and the target column ("Exited") into y_train and y_test.
from sklearn.model_selection import train_test_split

train_df, test_df = train_test_split(balanced_raw_no_age_df, test_size=0.20)

X_train = train_df.drop("Exited", axis=1)
y_train = train_df["Exited"]
X_test = test_df.drop("Exited", axis=1)
y_test = test_df["Exited"]

Then using GridSearchCV, we'll find the best-performing hyperparameters or settings and save them:

from sklearn.linear_model import LogisticRegression

# Logistic Regression grid params
log_reg_params = {
    "penalty": ["l1", "l2"],
    "C": [0.001, 0.01, 0.1, 1, 10, 100, 1000],
    "solver": ["liblinear"],
}

# Grid search for Logistic Regression
from sklearn.model_selection import GridSearchCV

grid_log_reg = GridSearchCV(LogisticRegression(), log_reg_params)
grid_log_reg.fit(X_train, y_train)

# Logistic Regression best estimator
log_reg = grid_log_reg.best_estimator_

Initialize ValidMind datasets

The last step for evaluating the model's performance is to initialize the ValidMind Dataset and Model objects in preparation for assigning model predictions to each dataset.

# Initialize the datasets into their own dataset objects
vm_train_ds = vm.init_dataset(
    input_id="train_dataset_final",
    dataset=train_df,
    target_column="Exited",
)

vm_test_ds = vm.init_dataset(
    input_id="test_dataset_final",
    dataset=test_df,
    target_column="Exited",
)

Initialize a ValidMind model

You'll also need to initialize a ValidMind model object (vm_model) that can be passed to other functions for analysis and tests on the data for each of our three models.

  • Despite the naming convention, ValidMind model objects can be any type of record you want to test, document, validate, or monitor with the ValidMind Library.
  • From classical statistical and machine learning models, to generative and agentic AI systems and more, the ValidMind model object provides a consistent wrapper around your record so it can be passed as a unified input to any ValidMind test or test suite, with results sent directly to the ValidMind Platform.

Initialize your model object with vm.init_model():

# Register the model
vm_model = vm.init_model(log_reg, input_id="log_reg_model_v1")

Assign predictions

Once the model has been registered you can assign predictions to the training and testing datasets.

  • The assign_predictions() method from the Dataset object can link existing predictions to any number of models.
  • This method links the model's class prediction values and probabilities to our vm_train_ds and vm_test_ds datasets.

If no prediction values are passed, the method will compute predictions automatically:

vm_train_ds.assign_predictions(model=vm_model)
vm_test_ds.assign_predictions(model=vm_model)
2026-09-24 21:47:12,306 - INFO(validmind.vm_models.dataset.utils): Running predict_proba()... This may take a while
2026-09-24 21:47:12,308 - INFO(validmind.vm_models.dataset.utils): Done running predict_proba()
2026-09-24 21:47:12,308 - INFO(validmind.vm_models.dataset.utils): Running predict()... This may take a while
2026-09-24 21:47:12,310 - INFO(validmind.vm_models.dataset.utils): Done running predict()
2026-09-24 21:47:12,311 - INFO(validmind.vm_models.dataset.utils): Running predict_proba()... This may take a while
2026-09-24 21:47:12,312 - INFO(validmind.vm_models.dataset.utils): Done running predict_proba()
2026-09-24 21:47:12,312 - INFO(validmind.vm_models.dataset.utils): Running predict()... This may take a while
2026-09-24 21:47:12,313 - INFO(validmind.vm_models.dataset.utils): Done running predict()

Run the model evaluation tests

In this next example, we'll focus on running the tests within the Model Development section of the documentation. Only tests associated with this section will be executed, and the corresponding results will be updated in the documentation.

  • Note the additional config that is passed to run_documentation_tests() — this allows you to override inputs or params in certain tests.
  • In our case, we want to explicitly use the vm_train_ds for the validmind.model_validation.sklearn.ClassifierPerformance:in_sample test, since it's supposed to run on the training dataset and not the test dataset.
test_config = {
    "validmind.model_validation.sklearn.ClassifierPerformance:in_sample": {
        "inputs": {
            "dataset": vm_train_ds,
            "model": vm_model,
        },
    }
}
results = vm.run_documentation_tests(
    section=["model_development"],
    inputs={
        "dataset": vm_test_ds,  # Any test that requires a single dataset will use vm_test_ds
        "model": vm_model,
        "datasets": (
            vm_train_ds,
            vm_test_ds,
        ),  # Any test that requires multiple datasets will use vm_train_ds and vm_test_ds
    },
    config=test_config,
)
Test suite complete!
34/34 (100.0%)

Test Suite Results: Binary Classification V2


Check out the updated documentation on ValidMind.

Template for binary classification models.

▶ Model Development

In summary

In this second notebook, you learned how to:

Next steps

Integrate custom tests

Now that you're familiar with the basics of using the ValidMind Library to run and log tests to provide evidence for your documentation, let's learn how to incorporate your own custom tests into ValidMind: 3 — Integrate custom tests


Copyright © 2023-2026 ValidMind Inc. All rights reserved.
Refer to LICENSE for details.
SPDX-License-Identifier: AGPL-3.0 AND ValidMind Commercial