%pip install -q validmindLog metrics over time
Learn how to track and visualize the temporal evolution of key model performance metrics with ValidMind.
- Key model performance metrics such as AUC, F1 score, precision, recall, and accuracy, are useful for analyzing the stability and trends in model performance indicators, helping to identify potential degradation or unexpected fluctuations in model behavior over time.
- By monitoring these metrics systematically, teams can detect early warning signs of model drift and take proactive measures to maintain model reliability.
- Unit metrics in ValidMind provide a standardized way to compute and track individual performance measures, making it easy to monitor specific aspects of model behavior.
Log metrics over time with the ValidMind Library's log_metric() function and visualize them in your documentation using the Metric Over Time block within the ValidMind Platform. This integration enables seamless tracking of model performance, supporting custom thresholds and facilitating the automation of alerts based on logged metrics.
Metrics over time are most commonly associated with the continued monitoring of a model's performance once it is deployed.
While you are able to add Metric Over Time blocks to model documentation, we recommend first enabling ongoing monitoring for your model to maximize the potential of your performance data.
While you are able to add Metric Over Time blocks to model documentation, we recommend first enabling ongoing monitoring for your model to maximize the potential of your performance data.
About ValidMind
ValidMind is a suite of tools for managing model risk, including risk associated with AI and statistical models.
You use the ValidMind Library to automate documentation and validation tests, and then use the ValidMind Platform to collaborate on model documentation. Together, these products simplify model risk management, facilitate compliance with regulations and institutional standards, and enhance collaboration between yourself and model validators.
Before you begin
This notebook assumes you have basic familiarity with Python, including an understanding of how functions work. If you are new to Python, you can still run the notebook but we recommend further familiarizing yourself with the language.
If you encounter errors due to missing modules in your Python environment, install the modules with pip install, and then re-run the notebook. For more help, refer to Installing Python Modules.
New to ValidMind?
If you haven't already seen our documentation on the ValidMind Library, we recommend you begin by exploring the available resources in this section. There, you can learn more about documenting models and running tests, as well as find code samples and our Python Library API reference.
For access to all features available in this notebook, you'll need access to a ValidMind account.
Register with ValidMind
Register with ValidMind
Key concepts
Model documentation: A structured and detailed record pertaining to a model, encompassing key components such as its underlying assumptions, methodologies, data sources, inputs, performance metrics, evaluations, limitations, and intended uses. It serves to ensure transparency, adherence to regulatory requirements, and a clear understanding of potential risks associated with the model’s application.
Documentation template: Functions as a test suite and lays out the structure of model documentation, segmented into various sections and sub-sections. Documentation templates define the structure of your model documentation, specifying the tests that should be run, and how the results should be displayed.
Tests: A function contained in the ValidMind Library, designed to run a specific quantitative test on the dataset or model. Tests are the building blocks of ValidMind, used to evaluate and document models and datasets, and can be run individually or as part of a suite defined by your model documentation template.
Custom tests: Custom tests are functions that you define to evaluate your model or dataset. These functions can be registered via the ValidMind Library to be used with the ValidMind Platform.
Inputs: Objects to be evaluated and documented in the ValidMind Library. They can be any of the following:
- model: A single model that has been initialized in ValidMind with
vm.init_model(). - dataset: Single dataset that has been initialized in ValidMind with
vm.init_dataset(). - models: A list of ValidMind models - usually this is used when you want to compare multiple models in your custom test.
- datasets: A list of ValidMind datasets - usually this is used when you want to compare multiple datasets in your custom test. See this example for more information.
Parameters: Additional arguments that can be passed when running a ValidMind test, used to pass additional information to a test, customize its behavior, or provide additional context.
Outputs: Custom tests can return elements like tables or plots. Tables may be a list of dictionaries (each representing a row) or a pandas DataFrame. Plots may be matplotlib or plotly figures.
Test suites: Collections of tests designed to run together to automate and generate model documentation end-to-end for specific use-cases.
Example: The classifier_full_suite test suite runs tests from the tabular_dataset and classifier test suites to fully document the data and model sections for binary classification model use-cases.
Setting up
Install the ValidMind Library
To install the library:
Initialize the ValidMind Library
Register sample model
Let's first register a sample model for use with this notebook:
In a browser, log in to ValidMind.
In the left sidebar, navigate to Inventory and click + Register Model.
Enter the model details and click Next > to continue to assignment of model stakeholders. (Need more help?)
For example, to register a model for use with this notebook, select the following use case:
Credit Risk - CECLSelect your own name under the MODEL OWNER drop-down.
Click Register Model to add the model to your inventory.
Apply documentation template
Once you've registered your model, let's select a documentation template. A template predefines sections for your model documentation and provides a general outline to follow, making the documentation process much easier.
In the left sidebar that appears for your model, click Documents and select Documentation.
Under TEMPLATE, select
Credit Risk Scorecard.Click Use Template to apply the template.
Get your code snippet
ValidMind generates a unique code snippet for each registered model to connect with your developer environment. You initialize the ValidMind Library with this code snippet, which ensures that your documentation and tests are uploaded to the correct model when you run the notebook.
- On the left sidebar that appears for your model, select Getting Started and click Copy snippet to clipboard.
- Next, load your model identifier credentials from an
.envfile or replace the placeholder with your own code snippet:
# Load your model identifier credentials from an `.env` file

%load_ext dotenv
%dotenv .env

# Or replace with your code snippet

import validmind as vm

vm.init(
    # api_host="...",
    # api_key="...",
    # api_secret="...",
    # model="...",
)
Initialize the Python environment
Next, let's import the necessary libraries and set up your Python environment for data analysis:
import xgboost as xgb
import numpy as np

from datetime import datetime, timedelta

from validmind.unit_metrics import list_metrics, describe_metric, run_metric
from validmind.api_client import log_metric

%matplotlib inline
Load demo model
We'll use a classification model trained on customer churn data to demonstrate ValidMind's metric logging capabilities.
- We'll employ a built-in classification dataset, process it through train-validation-test splits, and train an XGBoost classifier.
- The trained model and datasets are then initialized in ValidMind's framework, enabling us to track and monitor various performance metrics in the following sections.
# Import the sample dataset from the library

from validmind.datasets.classification import customer_churn

print(
    f"Loaded demo dataset with: \n\n\t• Target column: '{customer_churn.target_column}' \n\t• Class labels: {customer_churn.class_labels}"
)

raw_df = customer_churn.load_data()
raw_df.head()
train_df, validation_df, test_df = customer_churn.preprocess(raw_df)
x_train = train_df.drop(customer_churn.target_column, axis=1)
y_train = train_df[customer_churn.target_column]
x_val = validation_df.drop(customer_churn.target_column, axis=1)
y_val = validation_df[customer_churn.target_column]
model = xgb.XGBClassifier(early_stopping_rounds=10)
model.set_params(
eval_metric=["error", "logloss", "auc"],
)
model.fit(
x_train,
y_train,
eval_set=[(x_val, y_val)],
verbose=False,
)Once the datasets and model are prepared for validation, let's initialize the ValidMind dataset and model, specifying features and targets columns.
- The property
input_idallows users to uniquely identify each dataset and model. - This allows for the creation of multiple versions of datasets and models, enabling us to compute metrics by specifying which versions we want to use as inputs.
vm_raw_dataset = vm.init_dataset(
    dataset=raw_df,
    input_id="raw_dataset",
    target_column=customer_churn.target_column,
    class_labels=customer_churn.class_labels,
)

vm_train_ds = vm.init_dataset(
    dataset=train_df,
    input_id="train_dataset",
    target_column=customer_churn.target_column,
)

vm_test_ds = vm.init_dataset(
    dataset=test_df, input_id="test_dataset", target_column=customer_churn.target_column
)

vm_model = vm.init_model(
    model,
    input_id="model",
)
We can now use the assign_predictions() method from the Dataset object to link existing predictions to any model.
If no prediction values are passed, the method will compute predictions automatically:
vm_train_ds.assign_predictions(
    model=vm_model,
)

vm_test_ds.assign_predictions(
    model=vm_model,
)
Log metrics
Next, we'll use ValidMind to track the temporal evolution of key model performance metrics.
We'll set appropriate thresholds for each metric, enable automated alerting when performance drifts beyond acceptable boundaries, and demonstrate how these thresholds can be customized based on business requirements and risk tolerance levels.
metrics = [metric for metric in list_metrics() if "classification" in metric]

for metric_id in metrics:
    describe_metric(metric_id)
Run unit metrics
Compute individual metrics using ValidMind's unit metrics — single-value metrics that can be computed on a dataset and model. Use the run_metric() function from the validmind.unit_metrics module to calculate these metrics.
The run_metric() function has a signature similar to run_test() from the validmind.tests module, but is specifically designed for unit metrics and takes the following arguments:
metric_id: The unique identifier for the metric (for example,validmind.unit_metrics.classification.ROC_AUC)inputs: A dictionary containing the input dataset and model or their respective input IDsparams: A dictionary containing keyword arguments for the unit metric (optional, accepts anykwargsfrom the underlying sklearn implementation)
run_metric() returns and displays a result object similar to a regular ValidMind test, but only shows the unit metric value. While this result object has a .log() method for logging to the ValidMind Platform, in this use case we'll use unit metrics to compute performance metrics and then log them over time using the log_metric() function from the validmind.api_client module.
result = run_metric(
    "validmind.unit_metrics.classification.ROC_AUC",
    inputs={
        "model": vm_model,
        "dataset": vm_test_ds,
    },
)
auc = result.metric
result = run_metric(
"validmind.unit_metrics.classification.Accuracy",
inputs={
"model": vm_model,
"dataset": vm_test_ds,
},
)
accuracy = result.metricresult = run_metric(
"validmind.unit_metrics.classification.Recall",
inputs={
"model": vm_model,
"dataset": vm_test_ds,
},
)
recall = result.metricf1 = run_metric(
"validmind.unit_metrics.classification.F1",
inputs={
"model": vm_model,
"dataset": vm_test_ds,
},
)
f1 = result.metricprecision = run_metric(
"validmind.unit_metrics.classification.Precision",
inputs={
"model": vm_model,
"dataset": vm_test_ds,
},
)
precision = result.metricLog unit metrics over time
Using the log_metric() function from the validmind.api_client module, let's log the unit metrics over time. This function takes the following arguments:
key: The name of the metric to logvalue: The value of the metric to logrecorded_at: The timestamp of the metric to log — useful for logging historic predictionsthresholds: A dictionary containing the thresholds for the metric to logparams: A dictionary containing the keyword arguments for the unit metric (in this case, none are required, but we can pass anykwargsthat the underlying sklearn implementation accepts)
log_metric(
    key="AUC Score",
    value=auc,
    # If `recorded_at` is not included, the time at function run is logged
    recorded_at=datetime(2024, 1, 1),
)
To visualize the logged metric, we'll use the Metrics Over Time block in the ValidMind Platform:
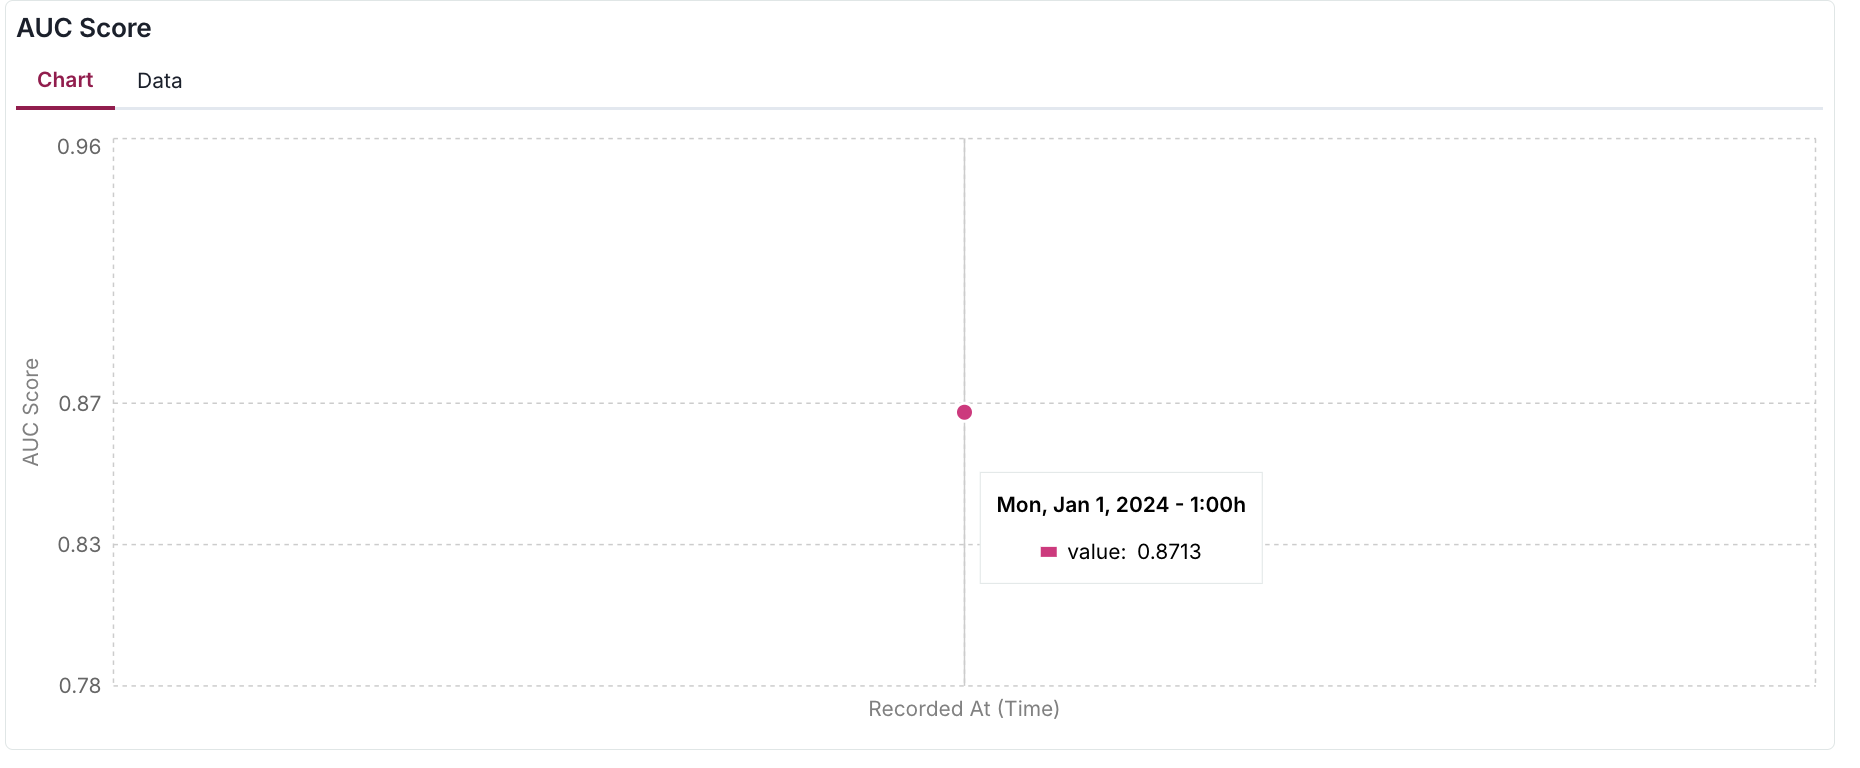
- After adding this visualization block to your documentation or ongoing monitoring report (as shown in the image below), you'll be able to review your logged metrics plotted over time.
- In this example, since we've only logged a single data point, the visualization shows just one measurement.
- As you continue logging metrics, the graph will populate with more points, enabling you to track trends and patterns.
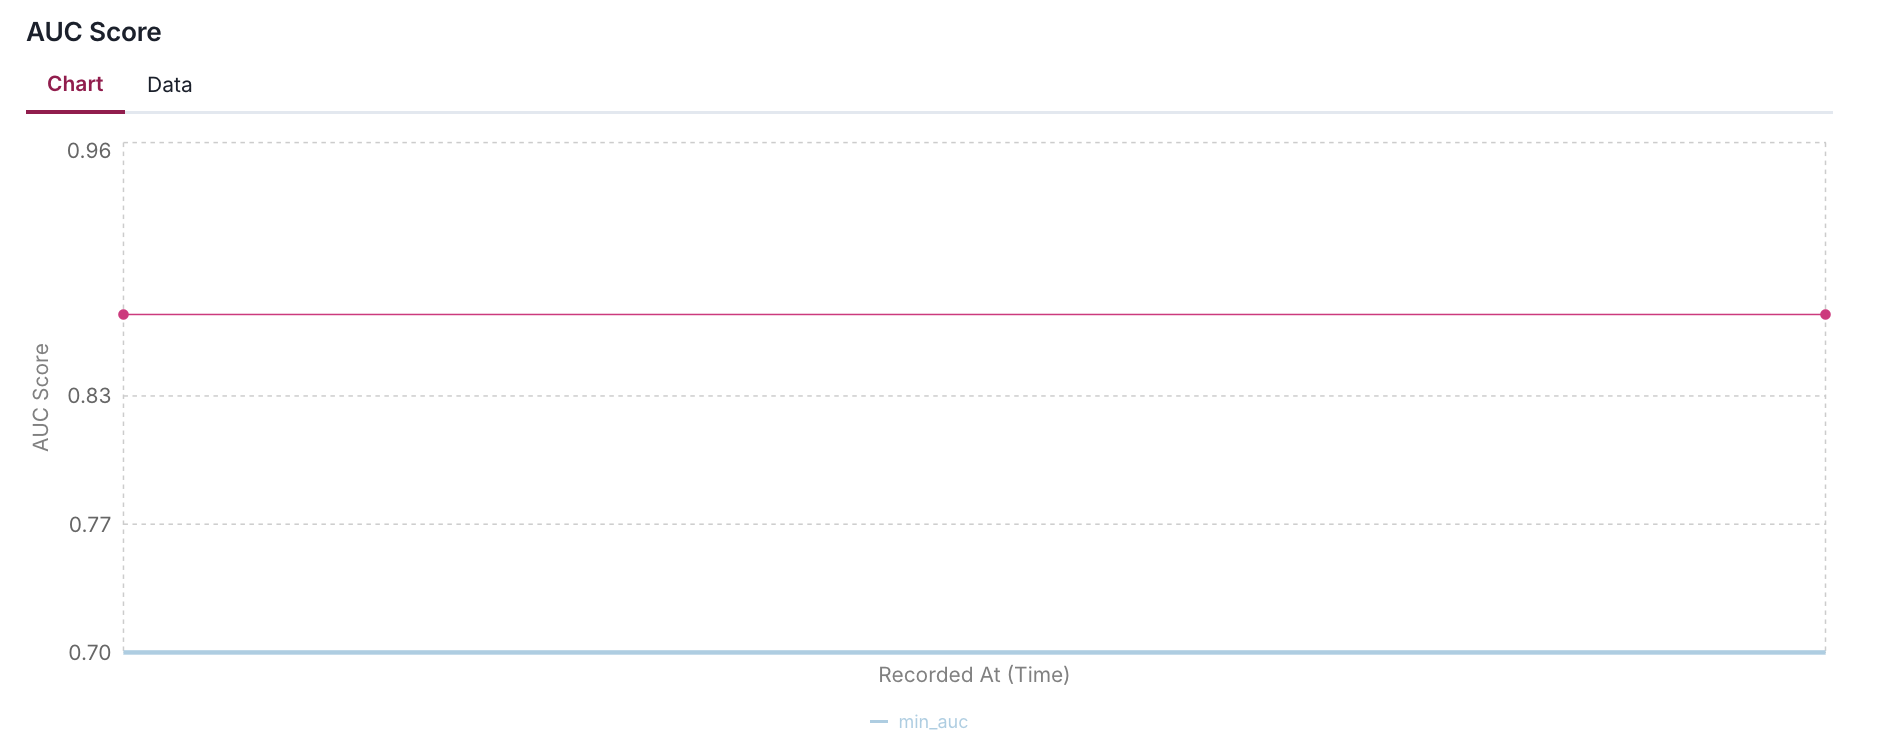
Pass thresholds
We can pass thresholds to the log_metric() function to enhance the metric over time:
- This is useful for visualizing the metric over time and identifying potential issues.
- The metric visualization component provides a dynamic way to monitor and contextualize metric values through customizable thresholds.
- These thresholds appear as horizontal reference lines on the chart.
- The system always displays the most recent threshold configuration, meaning that if you update threshold values in your client application, the visualization will reflect these changes immediately.
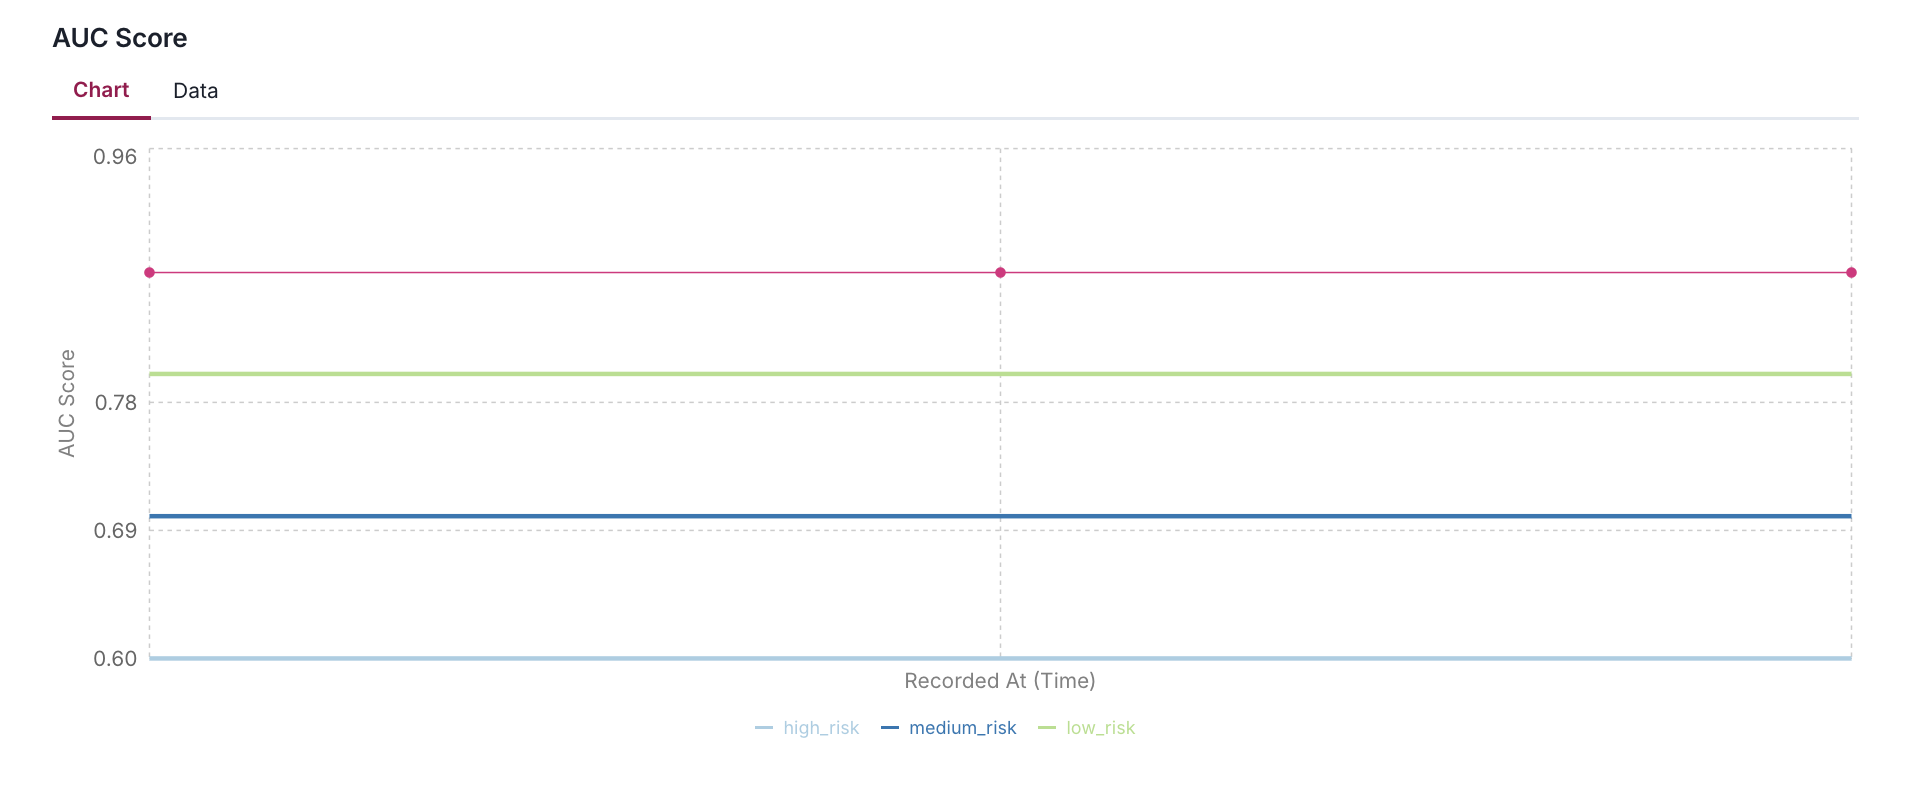
When a metric is logged without thresholds or with an empty threshold dictionary, the reference lines gracefully disappear from the chart, though the metric line itself remains visible.
Thresholds are highly flexible in their implementation. You can define them with any meaningful key names (such as low_risk, maximum, target, or acceptable_range) in your metric data, and the visualization will adapt accordingly.
log_metric(
    key="AUC Score",
    value=auc,
    recorded_at=datetime(2024, 1, 1),
    thresholds={
        "min_auc": 0.7,
    }
)
log_metric(
    key="AUC Score",
    value=auc,
    recorded_at=datetime(2024, 1, 1),
    thresholds={
        "high_risk": 0.6,
        "medium_risk": 0.7,
        "low_risk": 0.8,
    }
)
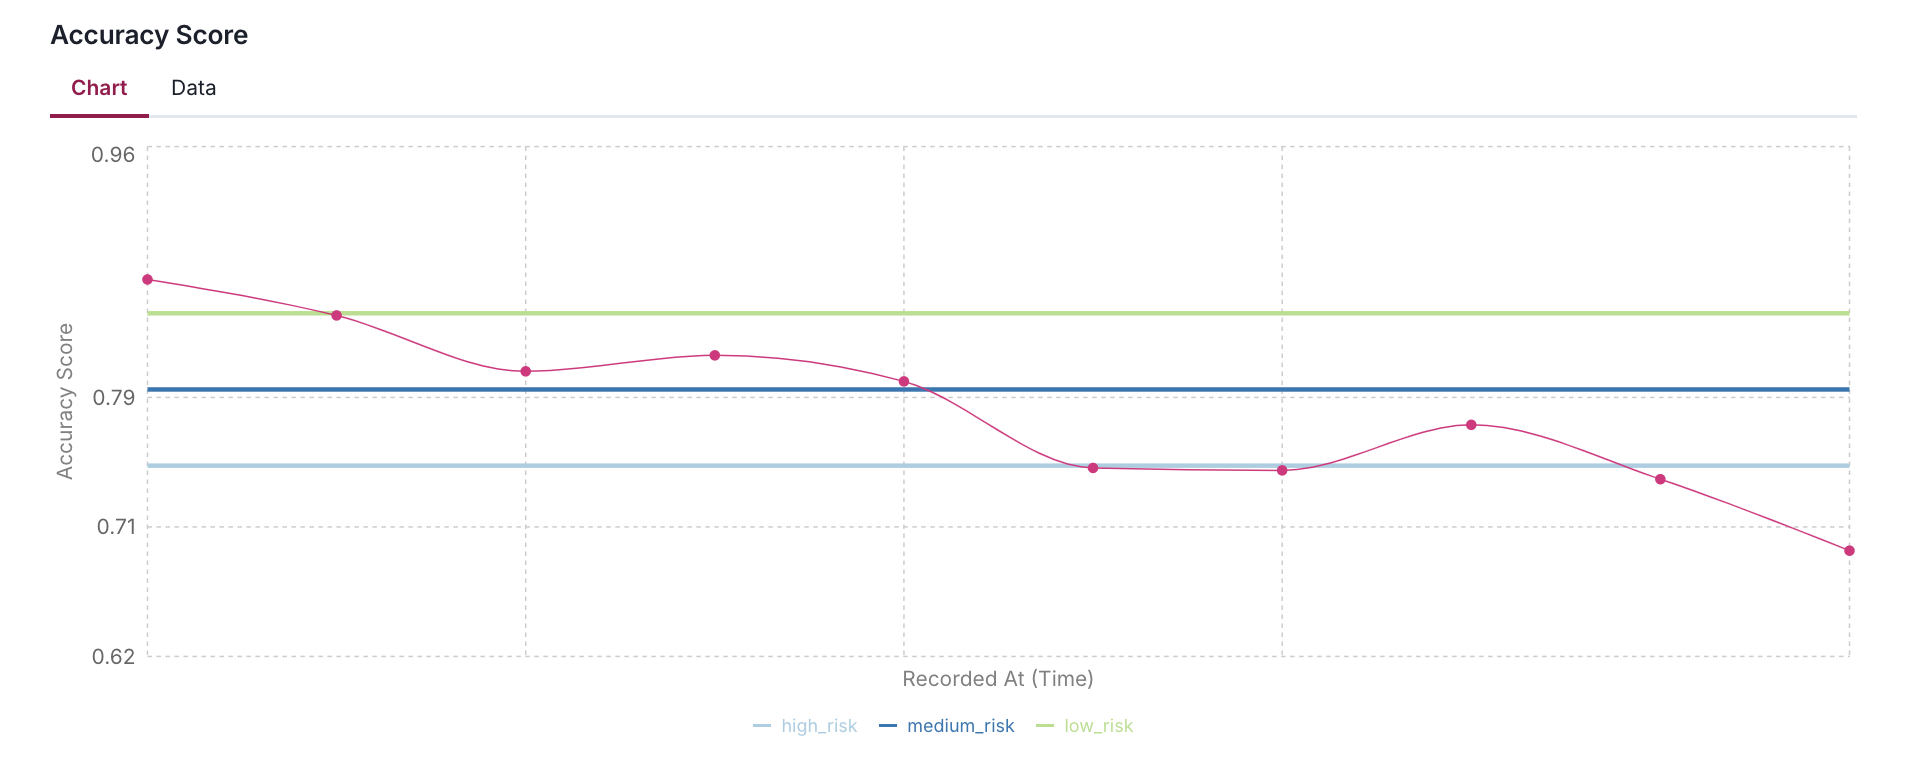
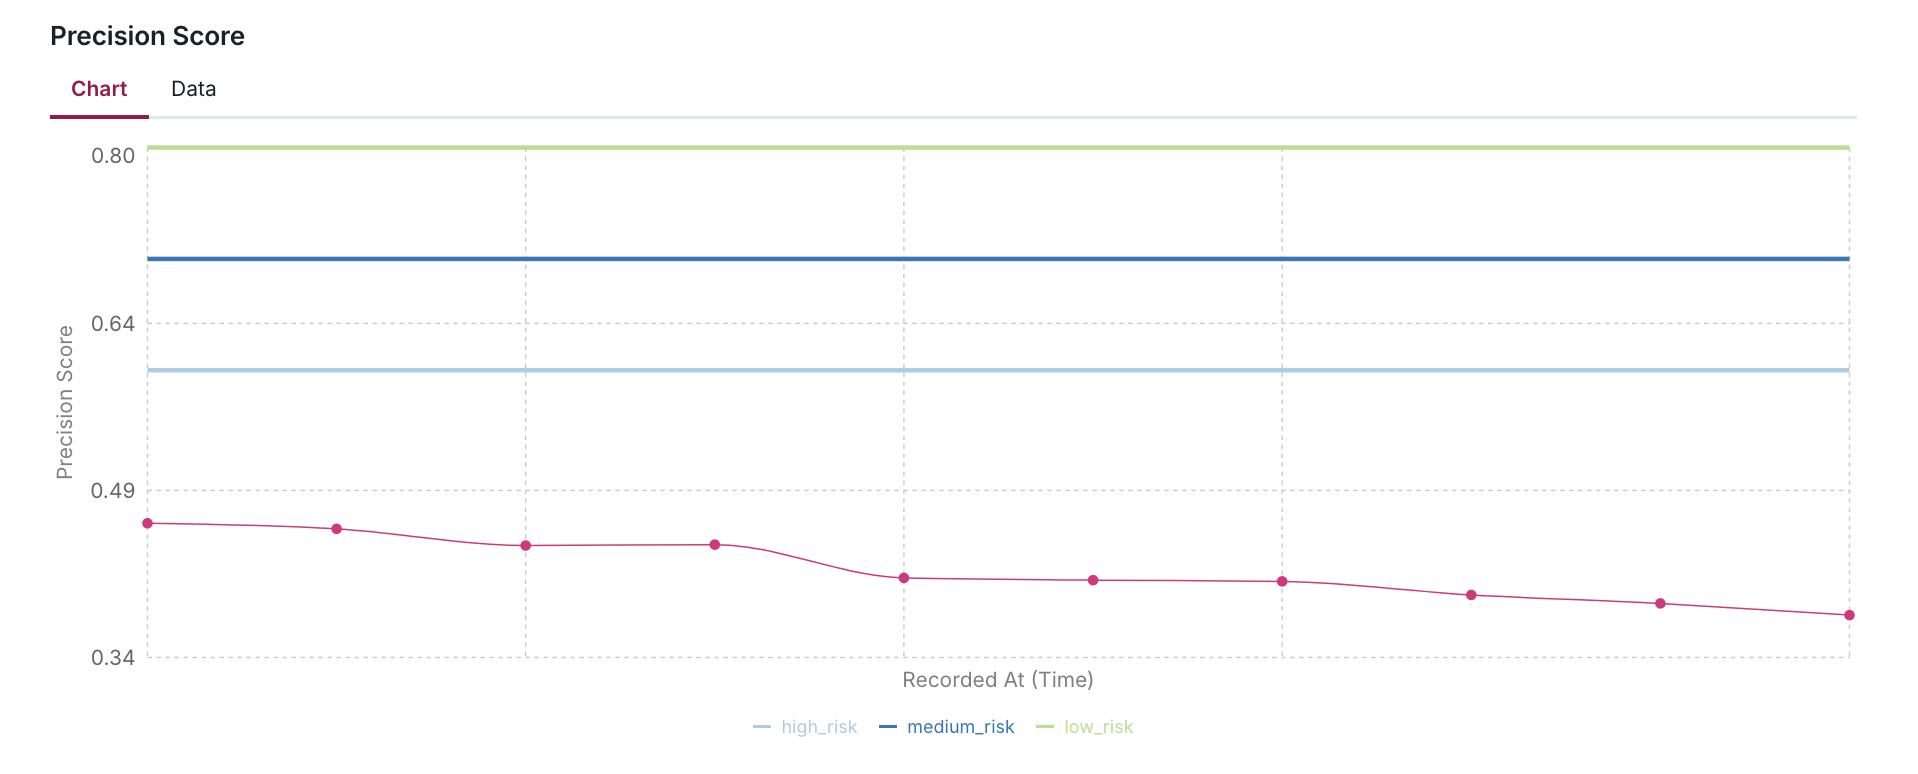
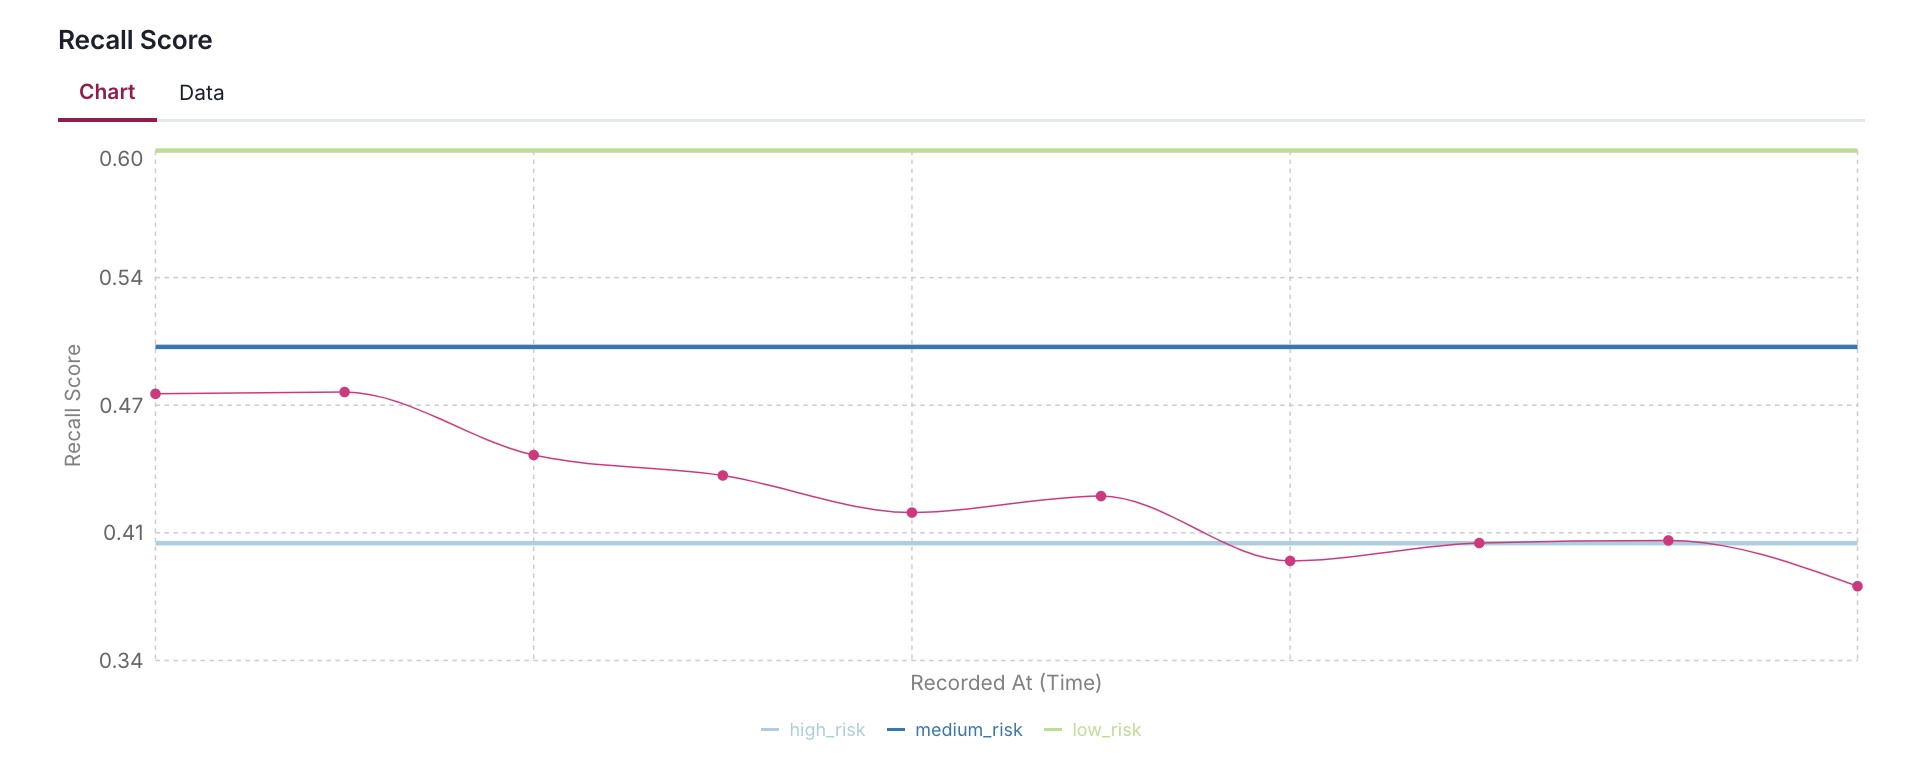
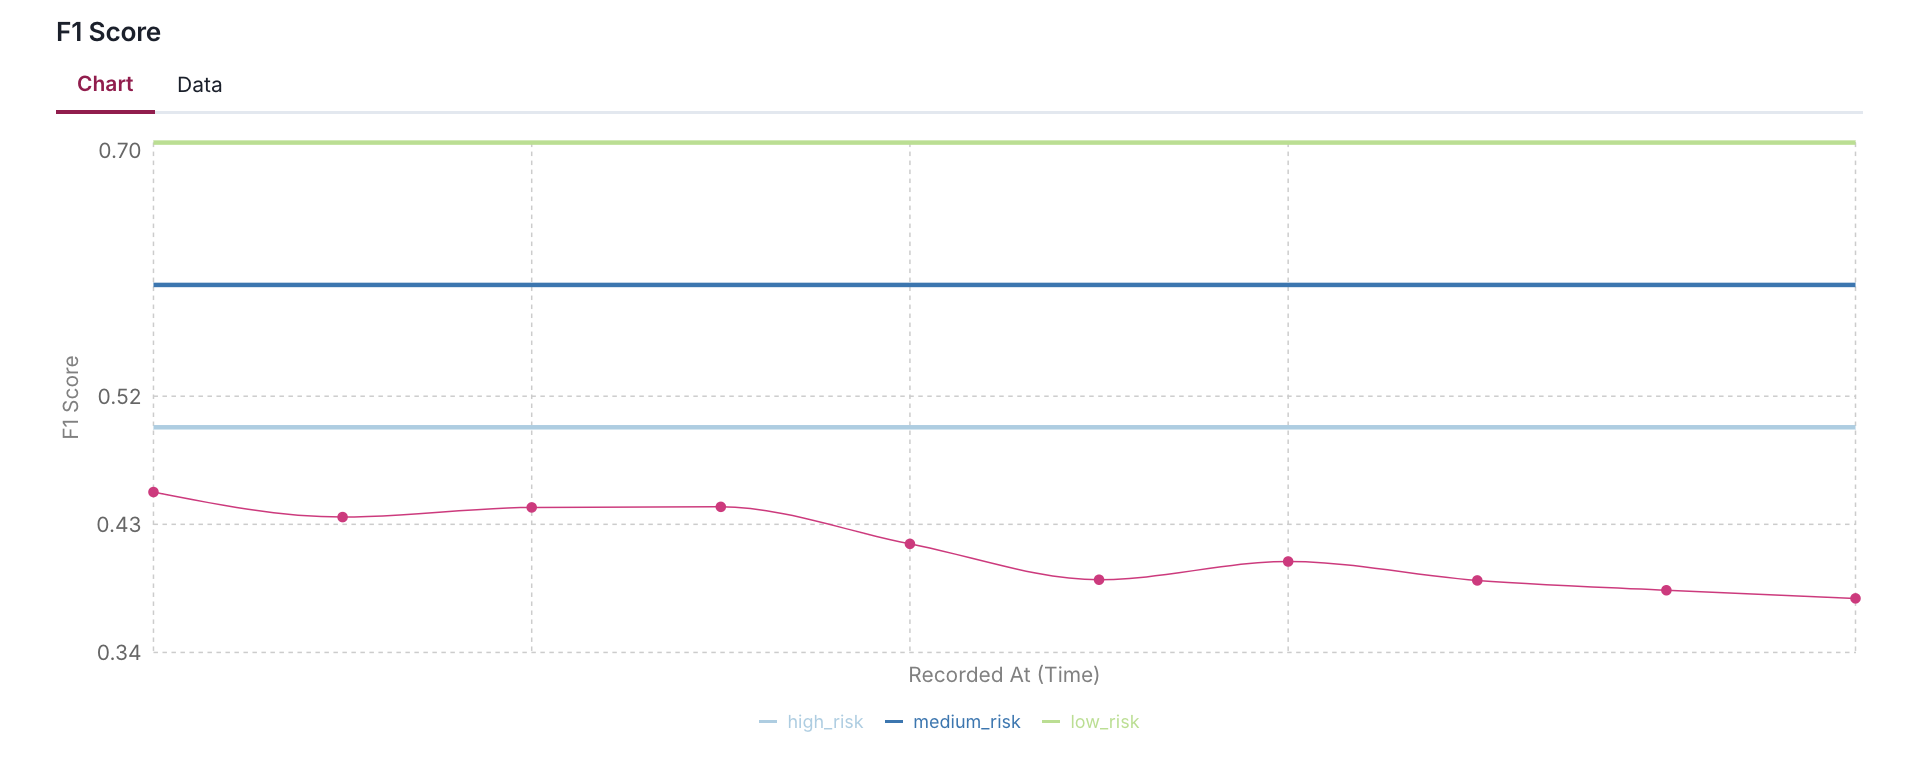
Log multiple metrics with custom thresholds
The following code snippet shows an example of how to set up and log multiple performance metrics with custom thresholds for each metric:
- Using AUC, F1, Precision, Recall, and Accuracy scores as examples, it demonstrates how to define different risk levels (high, medium, low) appropriate for each metric's expected range.
- The code simulates 10 days of metric history by applying a gradual decay and random noise to help visualize how metrics might drift over time in a production environment.
NUM_DAYS = 10
REFERENCE_DATE = datetime(2024, 1, 1)  # Fixed date: January 1st, 2024
base_date = REFERENCE_DATE - timedelta(days=NUM_DAYS)

# Initial values with their specific thresholds
performance_metrics = {
    "AUC Score": {
        "value": auc,
        "thresholds": {
            "high_risk": 0.7,
            "medium_risk": 0.8,
            "low_risk": 0.9,
        }
    },
    "F1 Score": {
        "value": f1,
        "thresholds": {
            "high_risk": 0.5,
            "medium_risk": 0.6,
            "low_risk": 0.7,
        }
    },
    "Precision Score": {
        "value": precision,
        "thresholds": {
            "high_risk": 0.6,
            "medium_risk": 0.7,
            "low_risk": 0.8,
        }
    },
    "Recall Score": {
        "value": recall,
        "thresholds": {
            "high_risk": 0.4,
            "medium_risk": 0.5,
            "low_risk": 0.6,
        }
    },
    "Accuracy Score": {
        "value": accuracy,
        "thresholds": {
            "high_risk": 0.75,
            "medium_risk": 0.8,
            "low_risk": 0.85,
        }
    }
}

# Trend parameters
trend_factor = 0.98  # Slight downward trend
noise_scale = 0.02   # Random fluctuation of ±2%

for i in range(NUM_DAYS):
    recorded_at = base_date + timedelta(days=i)
    print(f"\nrecorded_at: {recorded_at}")

    # Log each metric with trend and noise
    for metric_name, metric_info in performance_metrics.items():
        base_value = metric_info["value"]
        thresholds = metric_info["thresholds"]

        # Apply trend and add random noise
        trend = base_value * (trend_factor ** i)
        noise = np.random.normal(0, noise_scale * base_value)
        value = max(0, min(1, trend + noise))  # Ensure value stays between 0 and 1

        log_metric(
            key=metric_name,
            value=value,
            recorded_at=recorded_at.isoformat(),
            thresholds=thresholds
        )

        print(f"{metric_name:<15}: {value:.4f} (Thresholds: {thresholds})")
Add acceptable performance flag
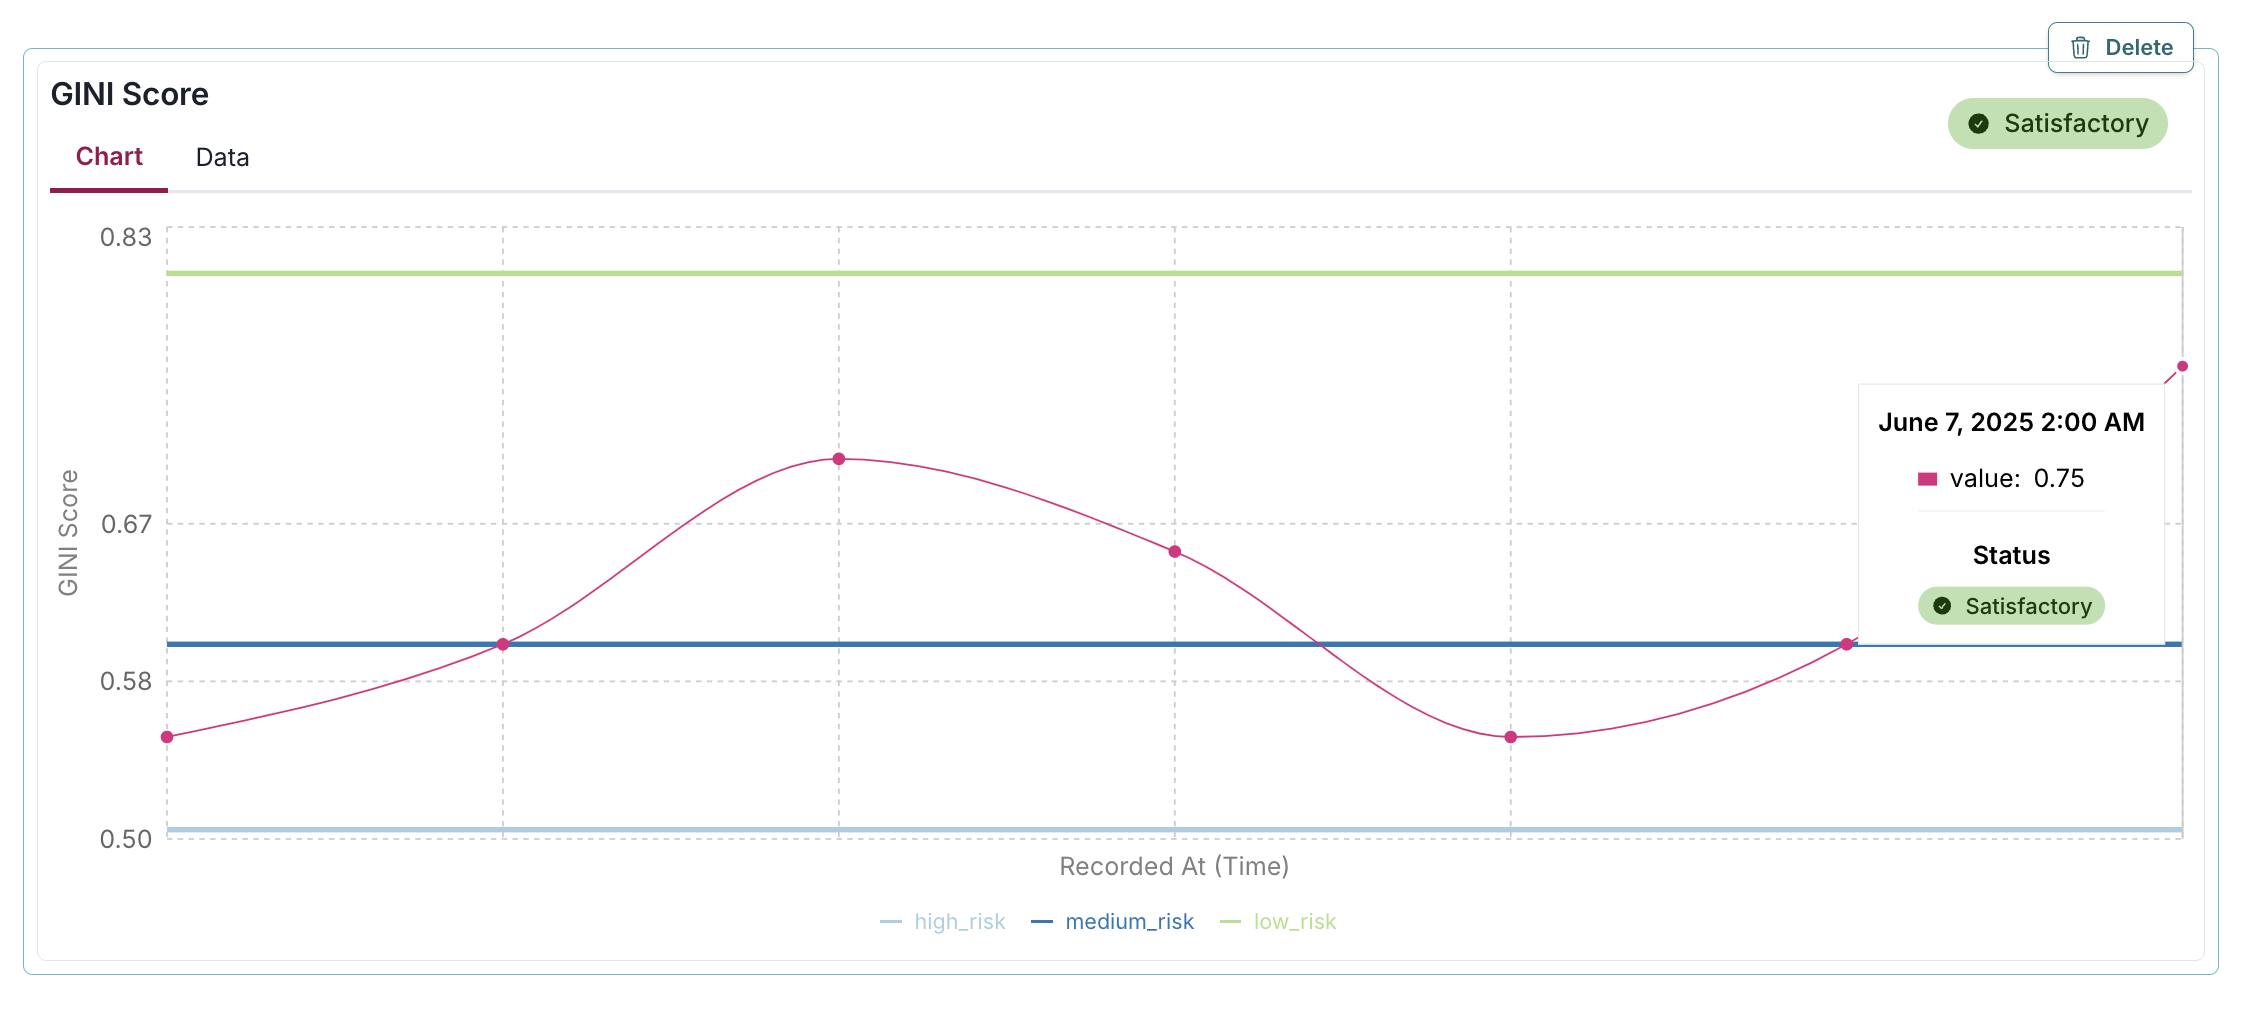
The passed parameter in the log_metric() function allows you to explicitly mark whether a specific metric value should be considered "Satisfactory" or "Requires Attention": - When passed=True: A green "Satisfactory" badge appears on the chart, indicating the metric value meets your acceptance criteria. - When passed=False: A yellow "Requires Attention" badge appears, highlighting potential concerns that may require investigation.
In the example below, the passed=True parameter adds a green "Satisfactory" badge to the GINI Score metric visualization, instantly indicating that the 0.75 value meets acceptable performance standards by being above the medium_risk threshold of 0.6:
log_metric(
    key="GINI Score",
    value=0.75,
    recorded_at=datetime(2025, 6, 7),
    thresholds = {
        "high_risk": 0.5,
        "medium_risk": 0.6,
        "low_risk": 0.8,
    },
    passed=True
)
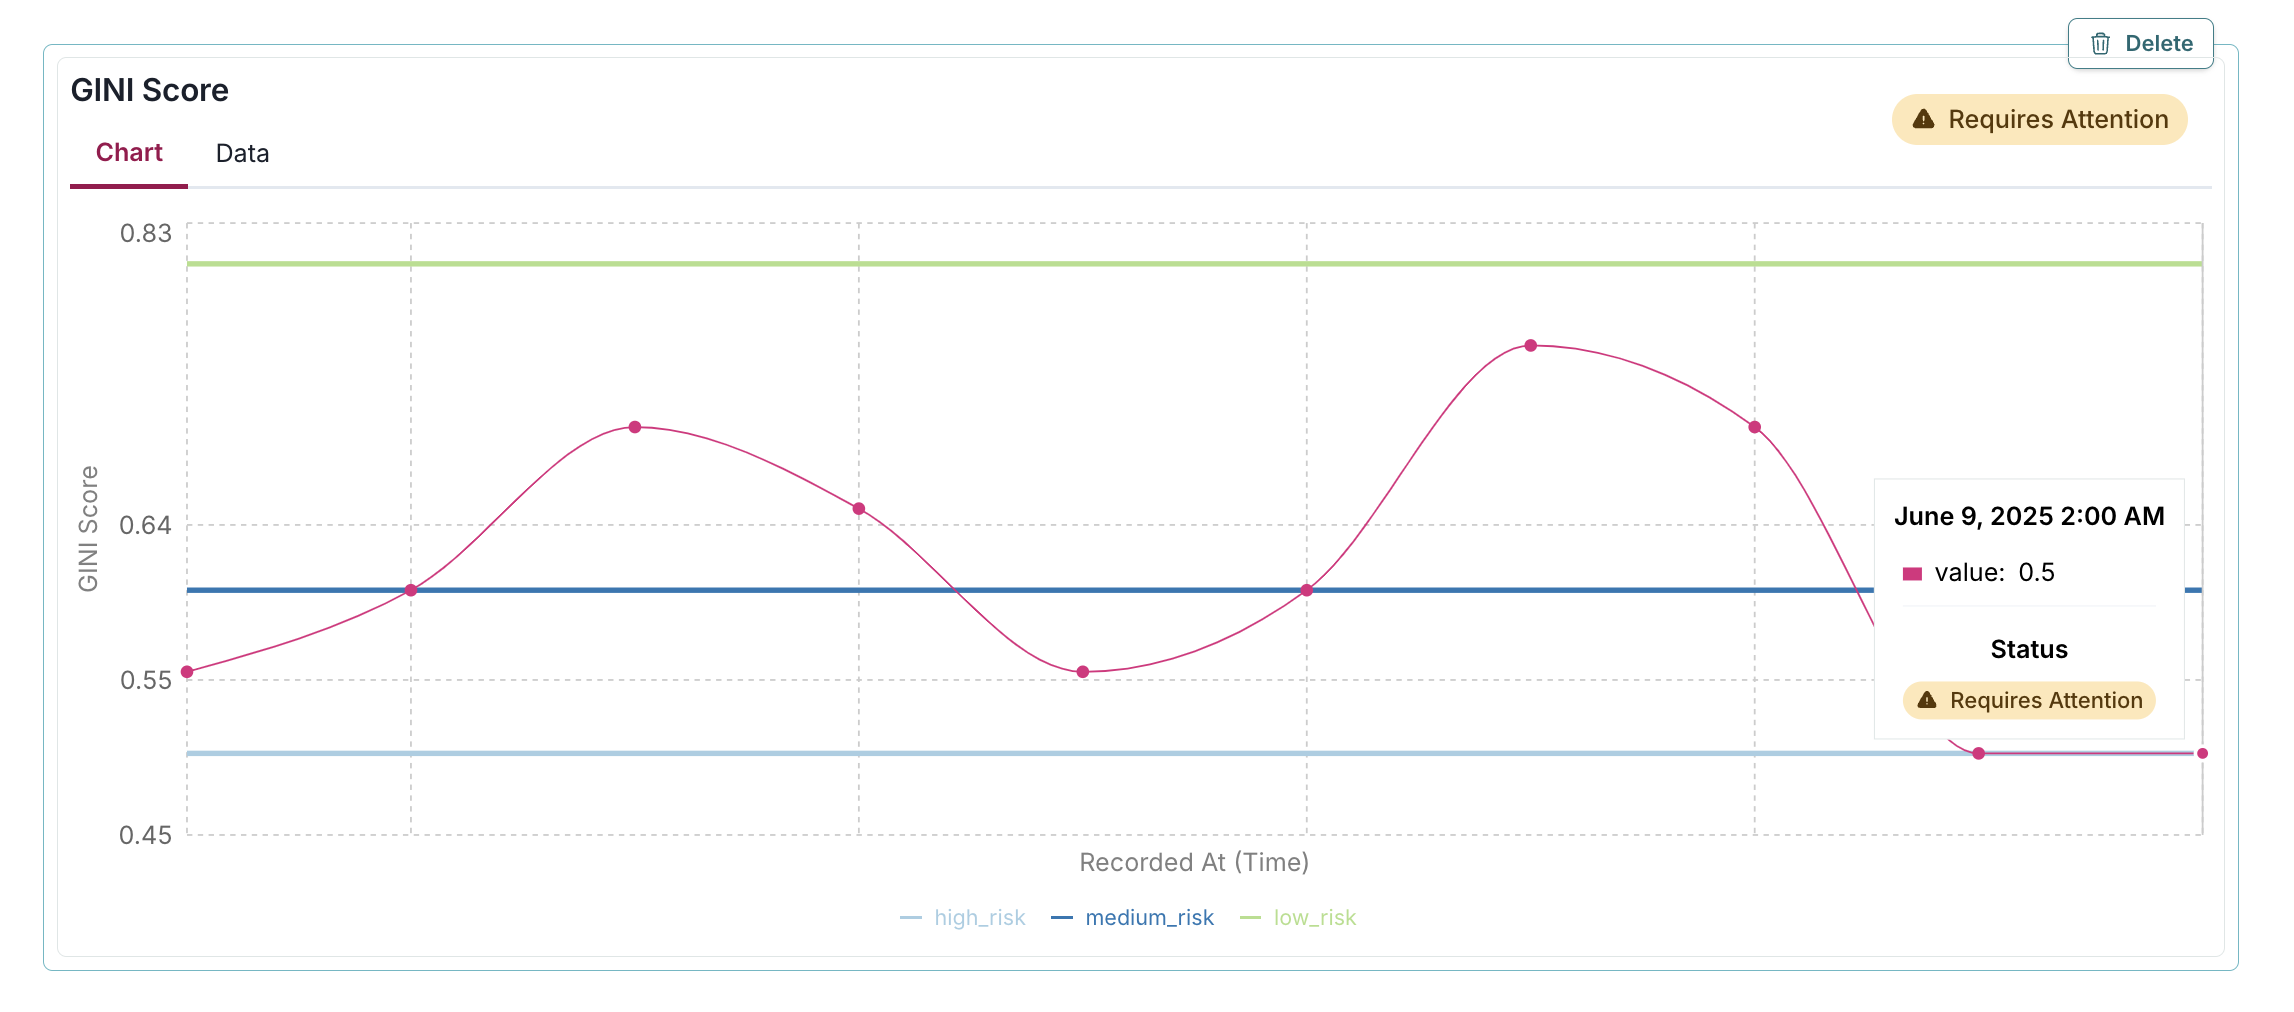
In this example, the passed=False parameter adds a yellow "Requires Attention" badge to the GINI Score metric visualization, immediately highlighting that the value of 0.5 fails to meet acceptable performance standards by not exceeding the medium_risk threshold of 0.6:
log_metric(
    key="GINI Score",
    value=0.5,
    recorded_at=datetime(2025, 6, 9),
    thresholds = {
        "high_risk": 0.5,
        "medium_risk": 0.6,
        "low_risk": 0.8,
    },
    passed=False
)
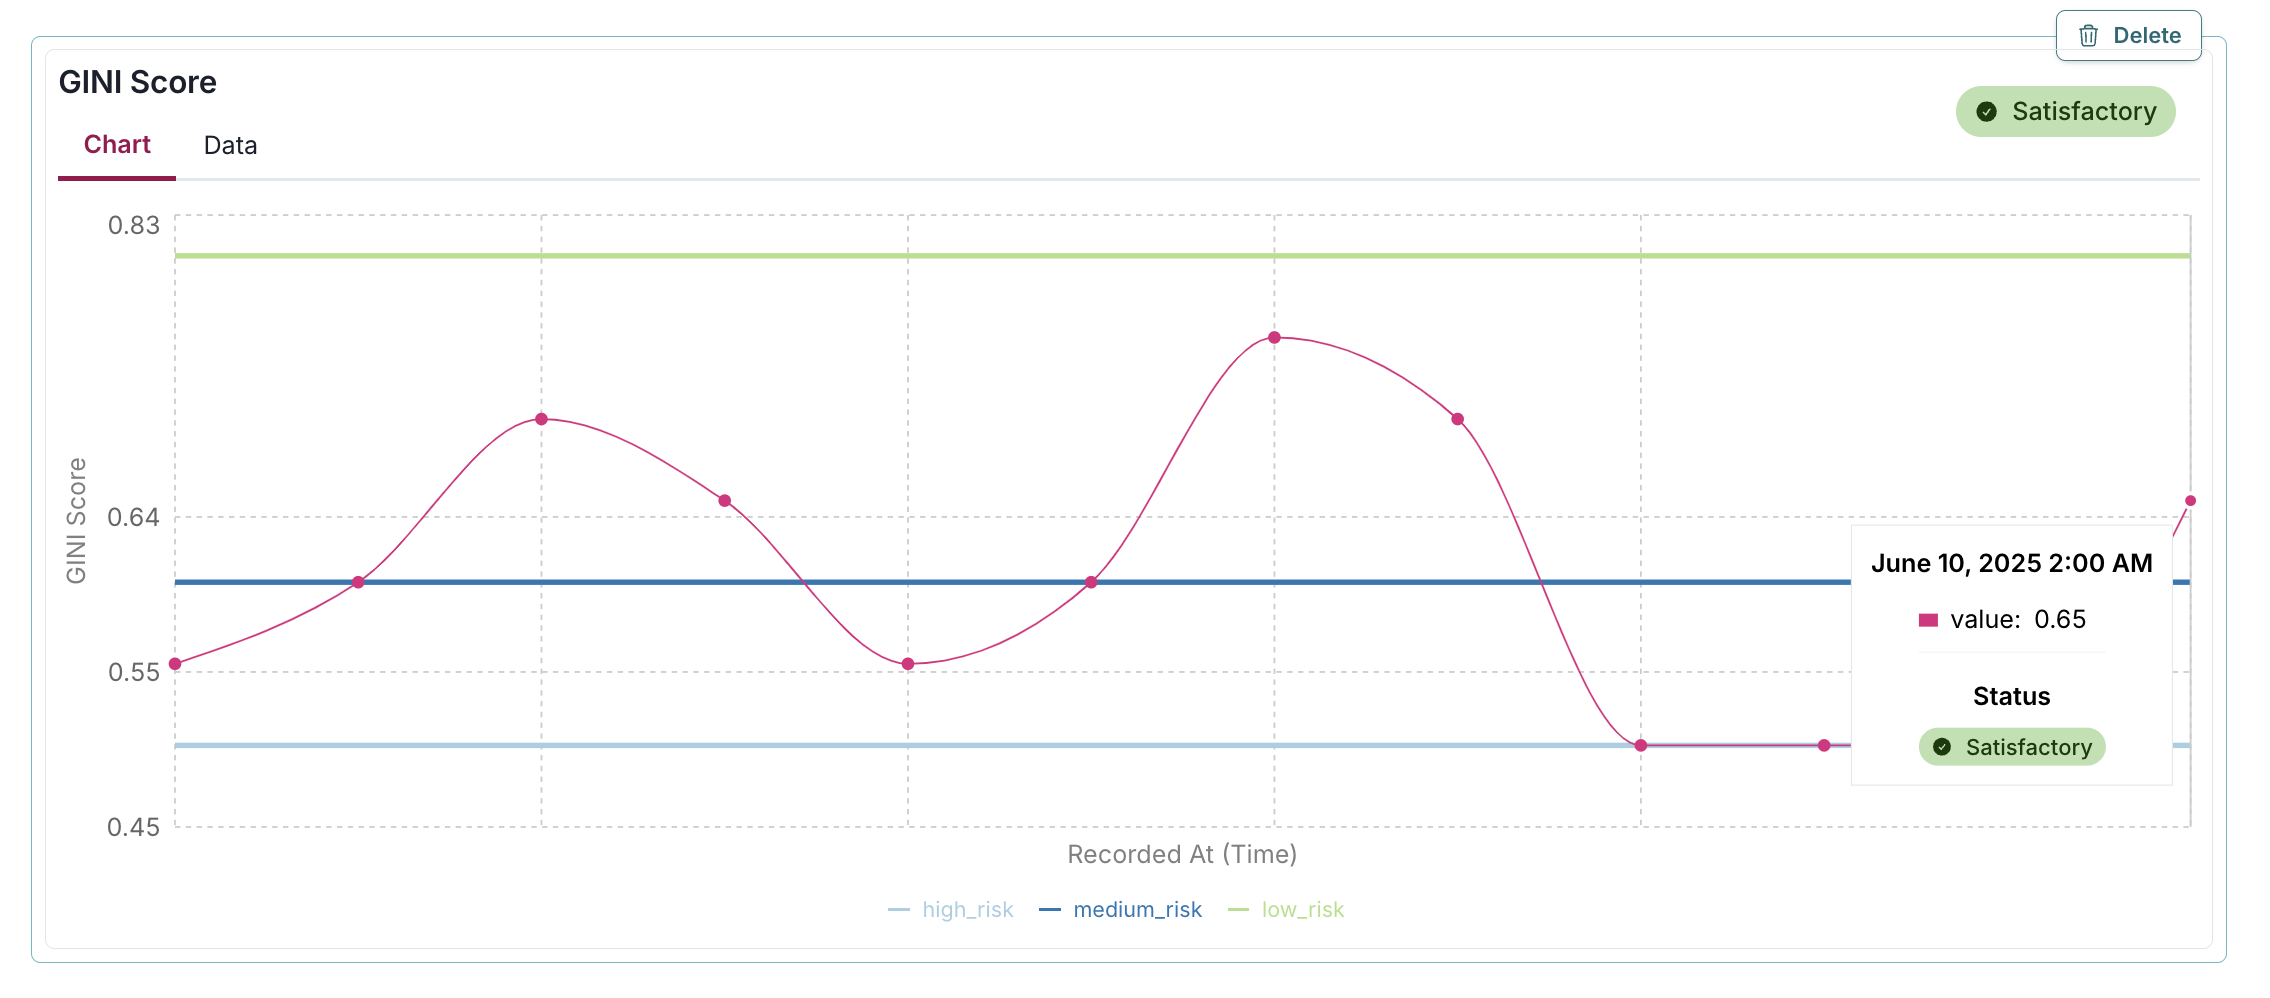
Here, a custom function passed_fn determines the badge status automatically, displaying a green "Satisfactory" badge for the 0.65 GINI Score because it exceeds the medium_risk threshold of 0.6, enabling programmatic evaluation of metric performance based on predefined business rules:
gini = 0.65

thresholds = {
    "high_risk": 0.5,
    "medium_risk": 0.6,
    "low_risk": 0.8,
}

def passed_fn(value):
    return value > thresholds["medium_risk"]

log_metric(
    key="GINI Score",
    value=gini,
    recorded_at=datetime(2025, 6, 10),
    thresholds=thresholds,
    passed=passed_fn(gini)
)
Next steps
You can look at the results of this test suite right in the notebook where you ran the code, as you would expect. But there is a better way — use the ValidMind Platform to work with your model documentation.
Work with your model documentation
From the Model Inventory in the ValidMind Platform, go to the model you registered earlier. (Need more help?)
Click and expand the Model Development section.
What you see is the full draft of your model documentation in a more easily consumable version. From here, you can make qualitative edits to model documentation, view guidelines, collaborate with validators, and submit your model documentation for approval when it's ready. Learn more ...
Discover more learning resources
We offer many interactive notebooks to help you document models:
Or, visit our documentation to learn more about ValidMind.
Upgrade ValidMind
After installing ValidMind, you’ll want to periodically make sure you are on the latest version to access any new features and other enhancements.
Retrieve the information for the currently installed version of ValidMind:
%pip show validmindIf the version returned is lower than the version indicated in our production open-source code, restart your notebook and run:
%pip install --upgrade validmindYou may need to restart your kernel after running the upgrade package for changes to be applied.