Review monitoring results
To ensure your record (model) continues to perform as expected, it’s important to regularly review the monitoring results generated during the ongoing monitoring process.
- As your code runs, the monitoring template for your record automatically populates with data, providing a comprehensive view of your record’s performance over time.
- You access and examine these results within the ValidMind Platform, allowing you to identify any deviations from expected performance and take corrective actions as needed.
Prerequisites
Steps
In the ValidMind Platform, click Inventory in the left sidebar.
Select a record or find your record by applying a filter or searching for it.5
In the left sidebar that appears for your record, click Documents and select the Latest tab.6
Select the Monitoring type file you previously sent monitoring test results to.7
- Explore the different sections of the template and review the results.
- Any deviations from the expected performance should be identified and acted on if necessary.
Satisfactory
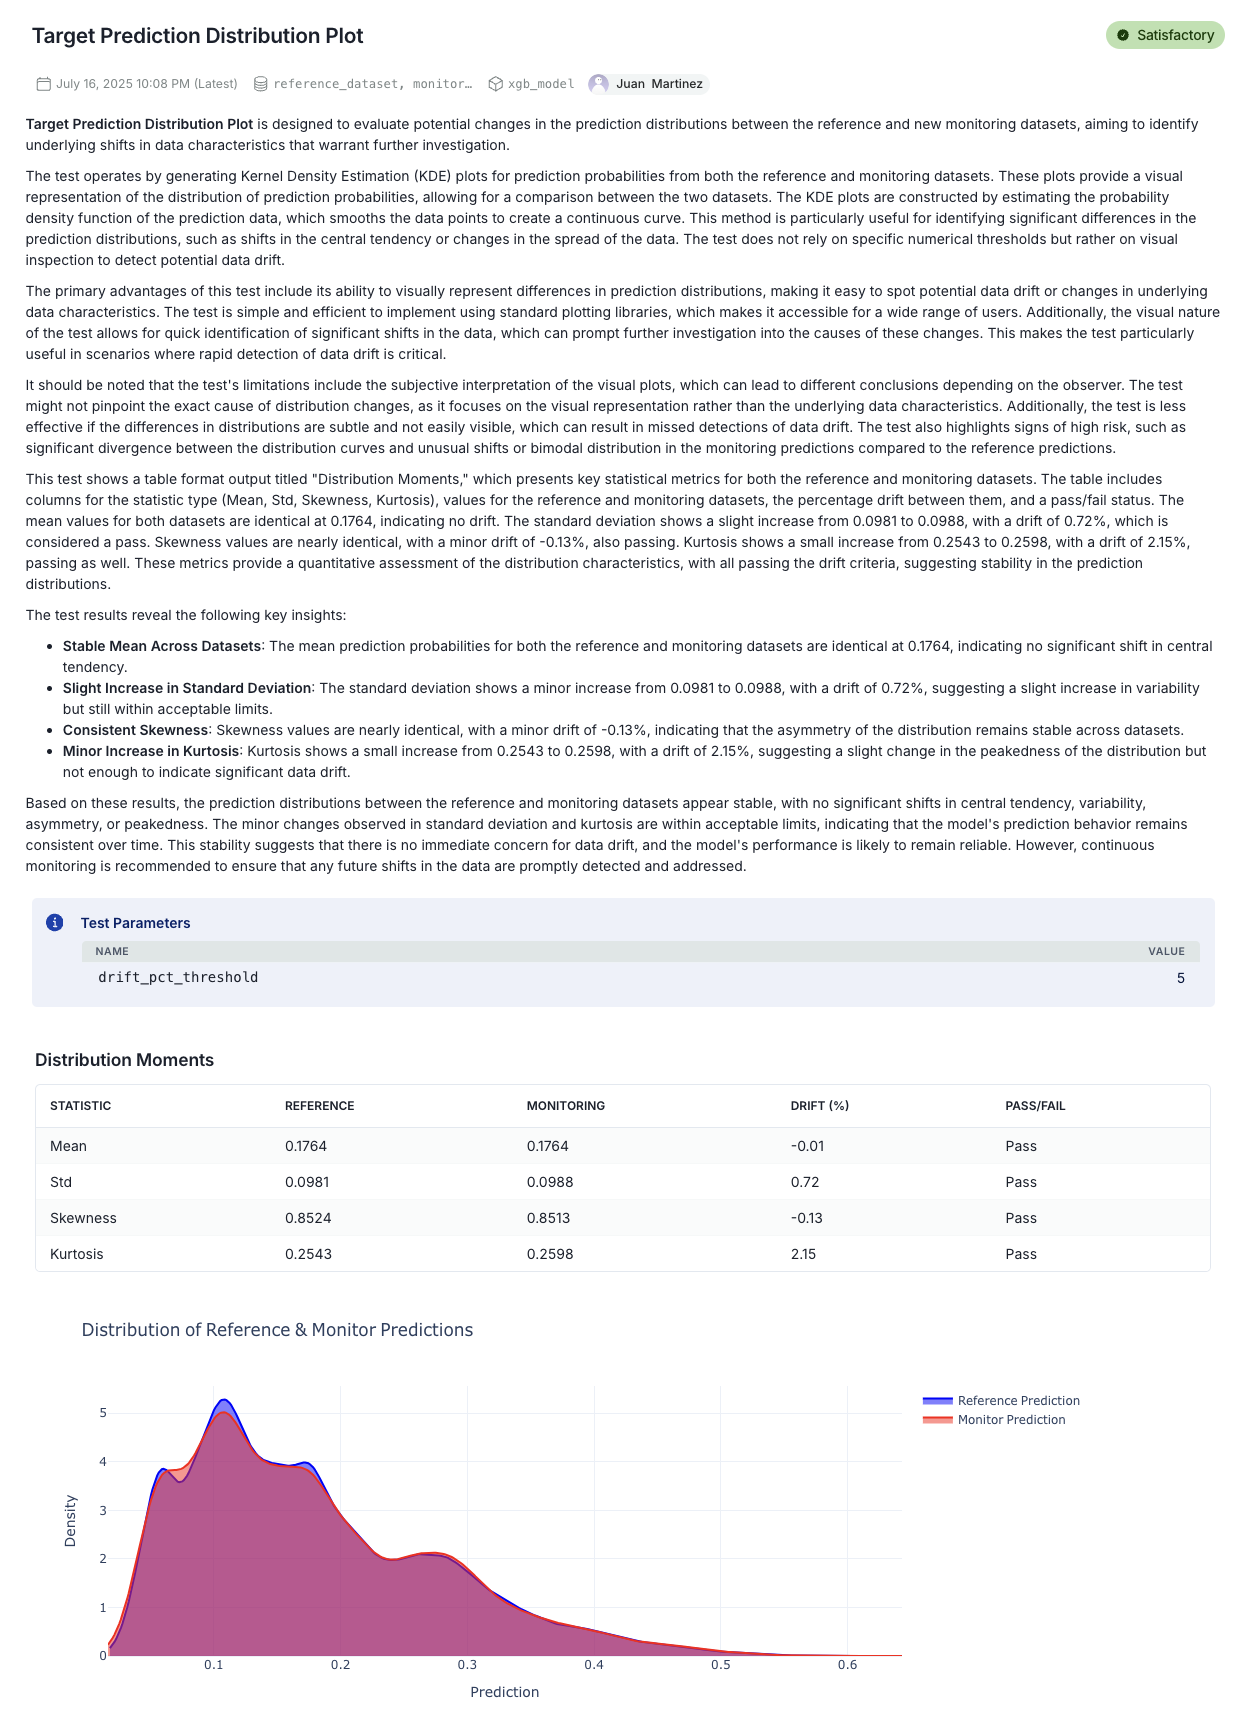
The results of a target prediction distribution plot, which is a diagnostic tool used to identify prediction drift (shifts in prediction distributions) between a reference dataset and a monitoring dataset.
The metric compares distributions via Kernel Density Estimation (KDE) and calculates key distribution moments (mean, standard deviation, skewness, and kurtosis) to detect changes. A prediction drift might suggest underlying changes in data characteristics that could impact model reliability.
Key findings:
- Mean: Identical for both datasets (0.1764), suggesting no shift in central tendency.
- Standard Deviation: Small increase from 0.0981 to 0.0988 (drift of 0.72%), still within acceptable range.
- Skewness: Minimal difference (drift of -0.13%), indicating similar asymmetry.
- Kurtosis: Slight increase from 0.2543 to 0.2598 (2.15% drift), hinting at a slightly sharper peak in the monitoring data.
All values are within the threshold of 5% (drift_pct_threshold = 5), and so all metrics pass.
Requires Attention
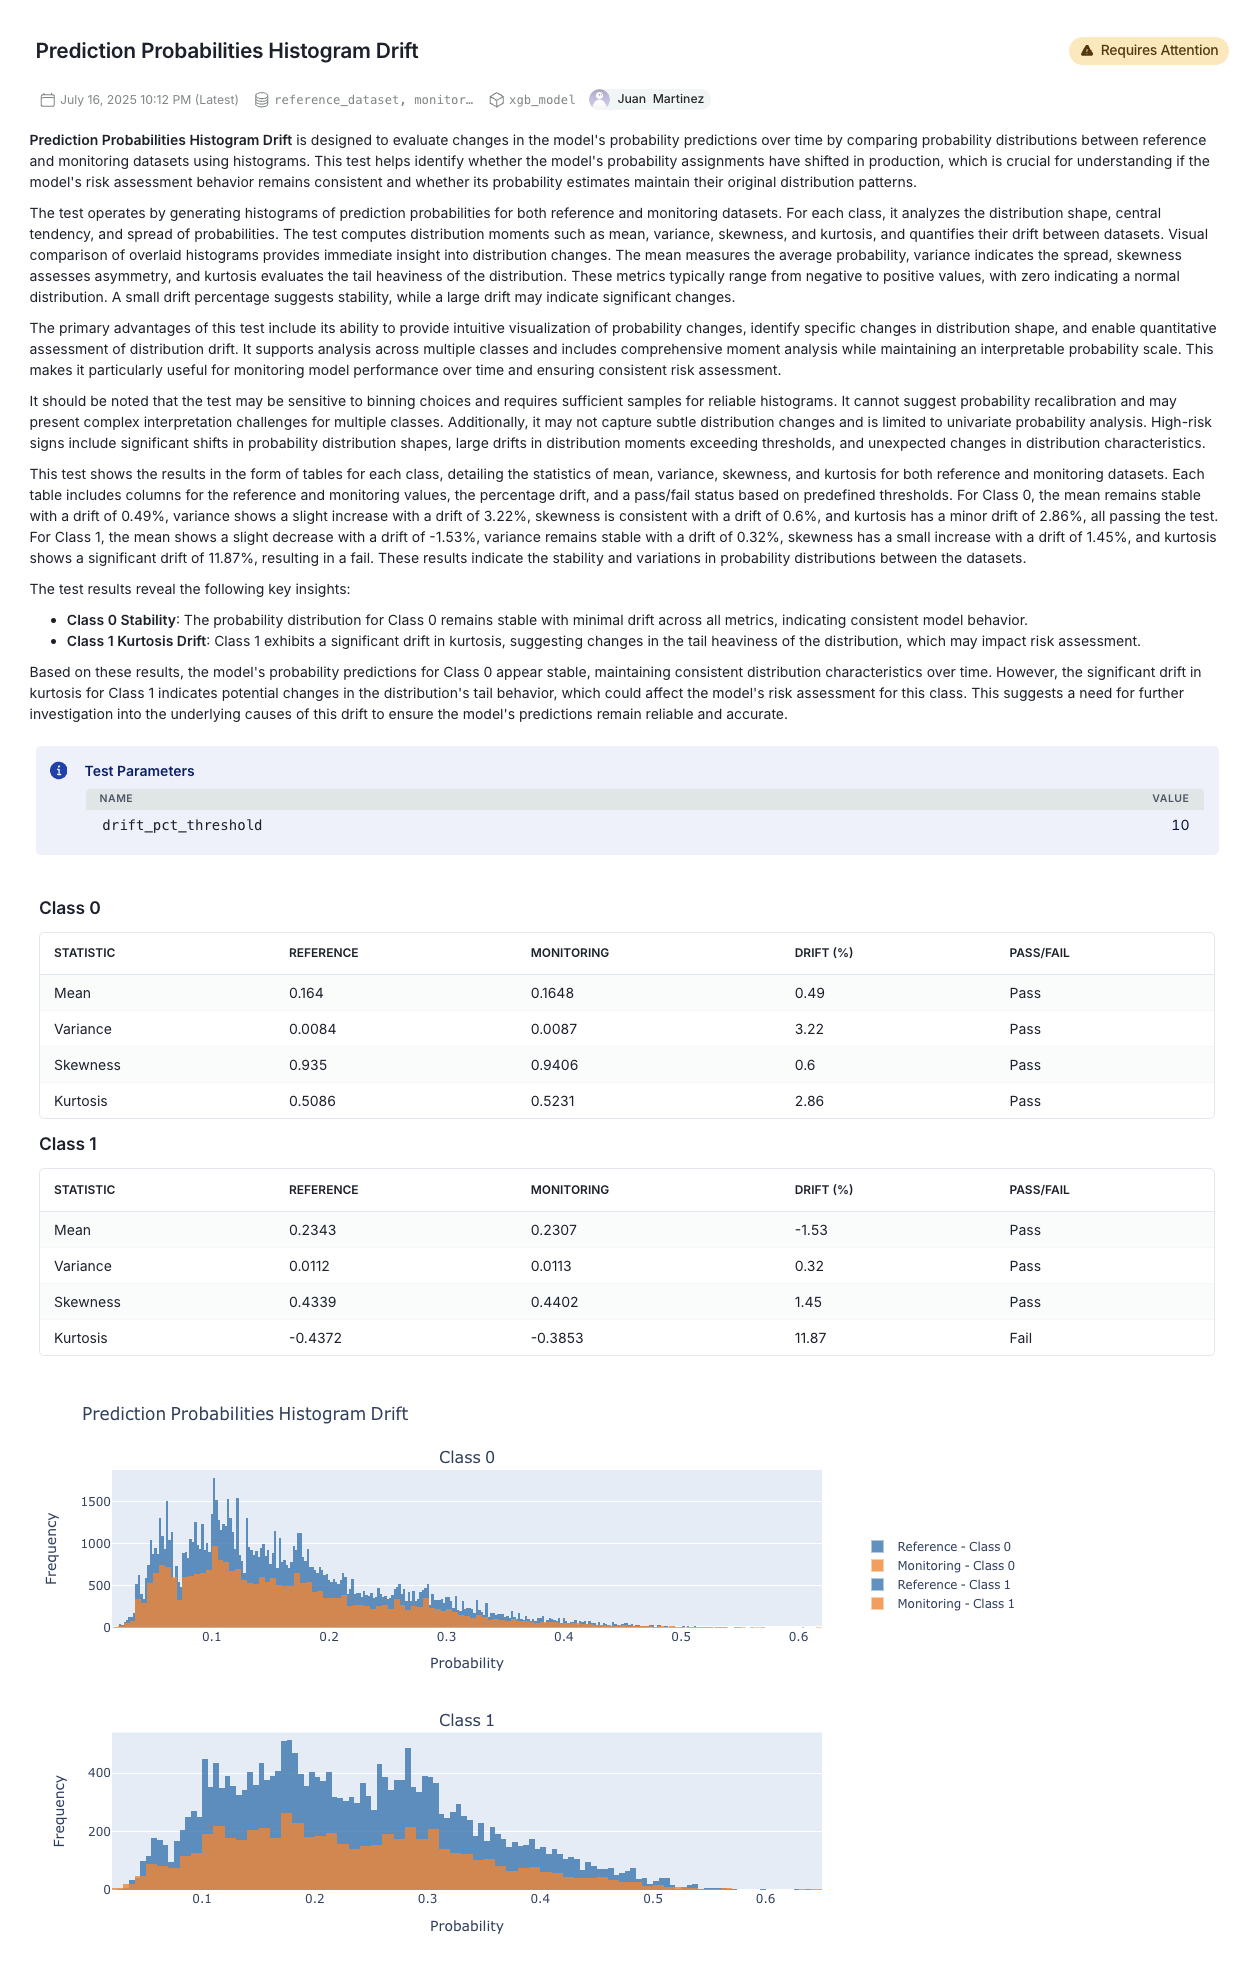
The output of a prediction probabilities histogram drift analysis, which evaluates whether a model’s predicted probabilities for each class have changed significantly between a reference dataset and a monitoring dataset. This is especially important for models where probability calibration is key to decision-making and risk assessment.
The metric analyzes histogram-based distribution metrics for Class 0 and Class 1 using four statistics:
- Mean: average prediction probability
- Variance: spread of the distribution
- Skewness: asymmetry
- Kurtosis: tail heaviness
Each metric includes reference and monitoring values, % drift, and pass/fail status based on a 10% drift threshold (drift_pct_threshold = 10).
The final assessment is that the model requires attention:
- The model is stable for Class 0
- Further investigation is needed for Class 1 due to the drift in kurtosis